


GOLD & CRUDE OIL TALKING POINTS:
- Gold price chart warns momentum may be ebbing near record high
- Crude oil prices struggle at chart resistance, top might be forming
- Size of new US fiscal stimulus effort in focus for market sentiment
A now-familiar dynamic reigned across financial markets yesterday. Real interest rates fell deeper into negative territory as the ADP employment data suggested that the US added just 167k jobs in July, falling well short of the 1.2 million payrolls rise expected by economists.
The outcome seemed to reinforce the sense that US monetary policy will remain at an ultra-dovish setting for the foreseeable future, lifting inflation expectations while nominal rates stayed near record lows. The 5-year breakeven rate, a gauge of price growth bets implied in bond markets, hit a 6-month high.
The markets responded as one might surmise they would. Gold rose on store-of-value demand. The metal yields nothing, but that is comparatively better to a negative real rate of return. Similarly, paltry but still-positive benchmark dividend yields helped stocks rise. Sentiment-geared crude oil prices followed.
GOLD, CRUDE OIL PRICES FOCUSED ON US FISCAL STIMULUS TALKS
Looking ahead, US fiscal stimulus negotiations may be in focus as officials scramble to get a deal done before Congress departs for a recess at the end of the week. Democrats have put up a proposal costing $3.5 trillion while Republicans countered with a $1 trillion scheme.
A deal seems likely as policymakers look ahead to November’s election, so its size will probably be most meaningful from a market-moving perspective. Anything shy of $2 trillion may be met with disappointment, boosting haven demand for the US Dollar and broadly hurting commodity prices.

GOLD TECHNICAL ANALYSIS
Gold prices are trading in uncharted territory having extended to a record high above the $2000/oz figure. Fibonacci expansion levels offer a crude guesstimate of oncoming upside barriers. A break above the 123.6% mark at 2059.74 may clear the way for a test of the 138.2% Fib at 2105.57. Negative RSI divergence warns of ebbing upside momentum however, which may be followed by a downturn. A drop below the 100% expansionat 1985.67 may then expose the 1918.49-20.94 area (78.6% Fib, 2011 swing top).
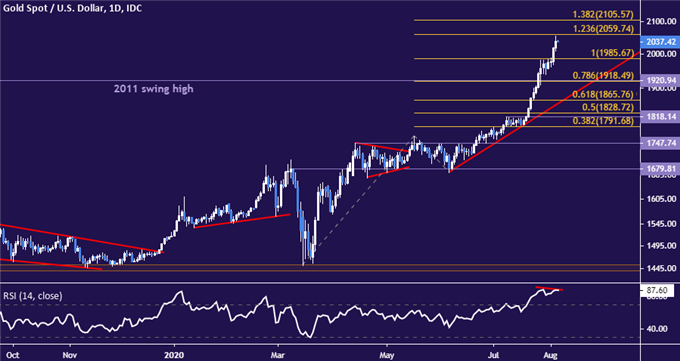
Gold price chart created using TradingView
CRUDE OIL TECHNICAL ANALYSIS
Crude oil prices pointedly recoiled from resistance in the 42.40-43.88 area, producing an imposing Shooting Star candlestick. Coupled with negative RSI divergence, the setup hints at exhaustion that might set the stage for bearish reversal. A daily close below swing low support at 38.74 looks likely to target the 34.38-78 zone next. Alternatively, a breach of resistance may put the $50/bbl figure in the crosshairs.
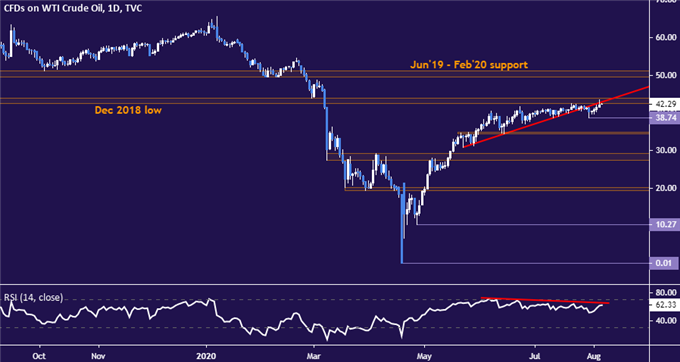
Crude oil price chart created using TradingView

COMMODITY TRADING RESOURCES
- See our free guide on the drivers of crude oil price trends
- What is your trading personality? Take our quiz to find out
- Join a free live webinar and have your questions answered
--- Written by Ilya Spivak, Head APAC Strategist for DailyFX
To contact Ilya, use the comments section below or @IlyaSpivak on Twitter


