


Gold, XAU/USD, Crude Oil, Trade War Fears - Talking Points:
- Gold prices rally amid depreciation in the US Dollar
- Crude oil rises with sentiment despite trade war woes
- Both assets exhibit bearish technical warning signs
Anti-fiat gold prices rallied over the past 24 hours as the haven-oriented US Dollar broadly depreciated. Longer-dated Treasury yields (10Y & 30Y) averaged little changed, meaning the focus for XAU/USD was on the counter currency. Risk appetite improved, pushing S&P 500 futures to erase losses seen during the Asia Pacific and European sessions. Growth-linked crude oil prices closed beyond a 3-month high.

Wall Street benchmark stock indexes averaged +0.78% as investors shrugged off rising cases of Covid-19 locally and externally. Texas Governor Gregg Abbott said that the virus was spreading ‘at an unacceptable rate’, adding that he may pause or reverse the state’s reopening process. Investors may have cheered commentary from President Donald Trump who mentioned that he supports another round of stimulus checks.
During Tuesday’s Asia Pacific trading session, risk appetite danced as US-China trade war fears waxed and waned. White House trade adviser Peter Navarro pulled a 180, walking back on an initial statement that seemed to point to a breakdown in the phase-one trade agreement. Crude oil prices temporarily dropped before reversing course and netting little changed.
Heading into European hours, futures tracking Wall Street indexes are little changed, hinting towards a neutral session for general market mood. Upcoming Markit PMI statistics from Germany, the Eurozone and the US are due. Data out of the world’s largest economy has been tending to outperform relative to economists’ expectations. More of the same could boost equities and crude oil. Gold could remain in range-bound trade.
Discover your trading personality to help find optimal forms of analyzing financial markets
Gold Technical Analysis
Gold has closed above the key resistance range between 1730 – 1747 on the daily chart below. Yet, confirmation of a breakout is lacking at this point. Immediate resistance sits above at 1765 as the upper shadow of May 18. Furthermore, negative RSI divergence warns that upside momentum is fading. This could precede a turn lower towards support at 1703.
| Change in | Longs | Shorts | OI |
| Daily | 1% | -3% | -1% |
| Weekly | 2% | -8% | -2% |
XAU/USD Daily Chart
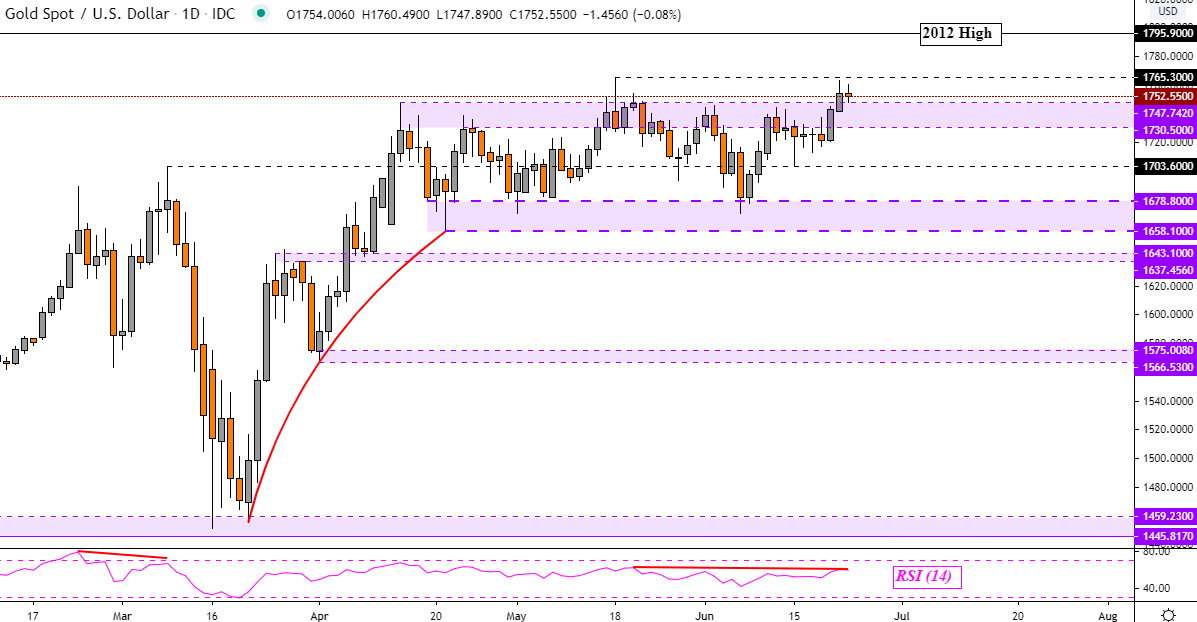
Chart Created Using TradingView
Crude Oil Technical Analysis
WTI crude oil prices close above resistance at 40.42. Mush like with XAU/USD, negative RSI divergence is present here which could foreshadow a turning point ahead. That may place the focus on rising support from April – red line on the daily chart below. A drop through this trend line exposes key support at 34.63. Otherwise, further gains may see prices test resistance at 43.87.
| Change in | Longs | Shorts | OI |
| Daily | 3% | -7% | 1% |
| Weekly | 31% | -38% | 7% |
WTI Crude Oil Daily Chart
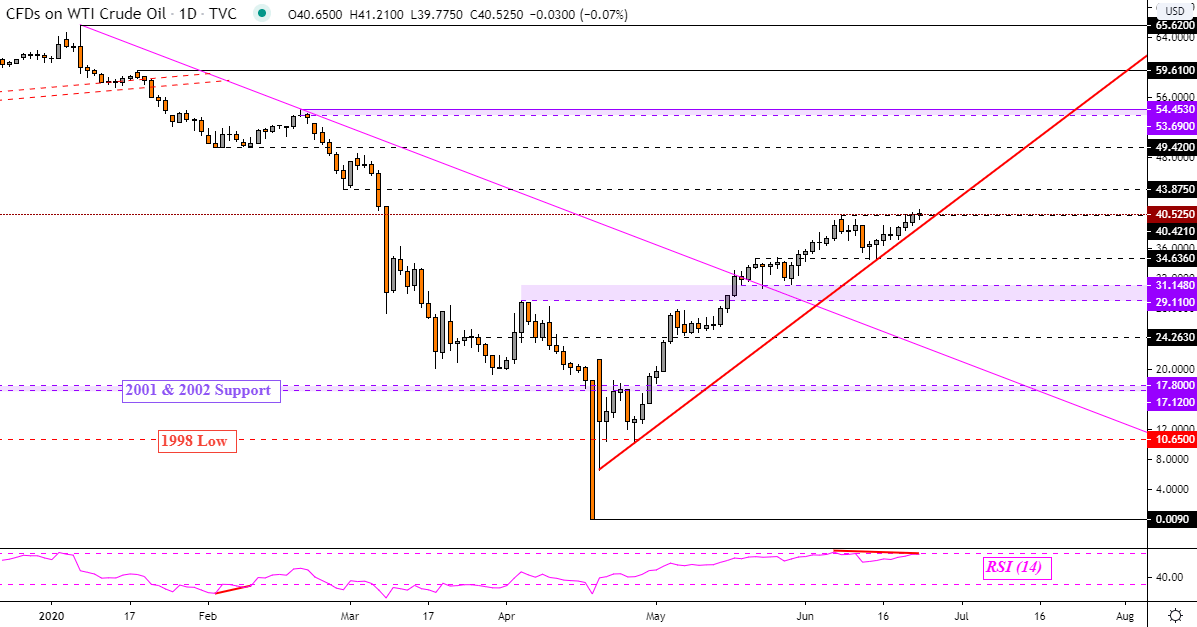
Chart Created Using TradingView
--- Written by Daniel Dubrovsky, Currency Analyst for DailyFX.com
To contact Daniel, use the comments section below or @ddubrovskyFX on Twitter


