FOMC, EUR/USD, Europe Open, S&P 500, Monetary Policy - Talking Points:
- Risk assets shrugged of coronavirus concerns during Asia-Pacific trade, pushing higher despite confirmed cases surpassing 9 million globally
- The Federal Reserve’s balance sheet shrank by $74 billion last week. Could that be behind the recent resurgence in the US Dollar?
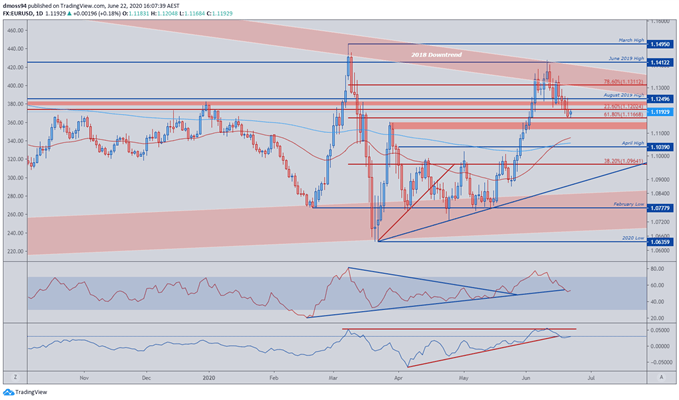
- EUR/USD perched at 61.8% Fibonacci support after 4-days of losses, with technical studies suggesting there may be further to go.
Asia-Pacific Recap
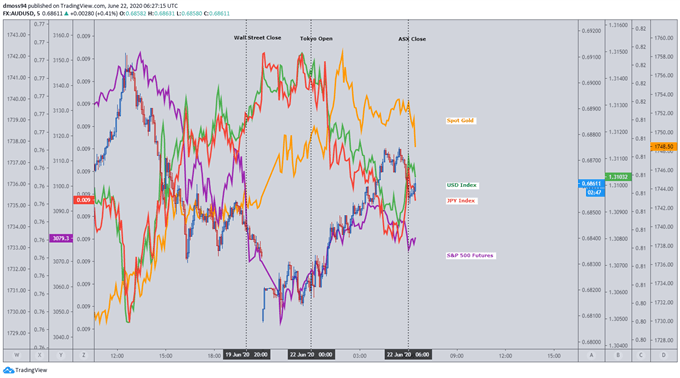
Despite gapping lower early in the Asia-Pacific session, the Australia Dollar clawed back lost ground as RBA Governor Philip Lowe “finds it hard to argue” that the local currency “is over-valued”.
Risk assets shook off coronavirus concerns, despite global cases surpassing 9 million, as the haven-associated US Dollar and Japanese Yen plunged. S&P 500 futures followed the ASX 200 higher.
Gold pushed back above $1,750 for the first time in over a month whilst yields on US 10-year Treasuries dipped back below 70 basis points.
Looking forward, speeches from Bundesbank President Jens Weidmann and Bank of Canada Governor Tiff Macklem headline the economic docket, with existing home sales for May providing an insight into the preliminary recovery of the US housing market.

Cross-asset analysis chart created using TradingView
Federal Reserve Balance Sheet Contraction Halts S&P 500 Rally
The recent recovery in the haven-associated US Dollar, and the simultaneous decline in the S&P 500, has been broadly attributed to risk aversion as global coronavirus cases continue to climb.
However, a major underlying factor behind the current weakness in US equity markets may be due to the $74 billion contraction of the Federal Reserve’s balance sheet in the week ending June 17. This prompts an obvious question: is there really no limit to the central bank’s quantitative easing (QE) program?
After expanding by an average of $250 billion per week from March 18 through to the end of May, the Federal Reserve has severely scaled back its asset purchasing program, averaging a measly $14 billion per week in the month of June.


Sources – Federal Reserve, Yahoo Finance
With the central bank adding a staggering $2.93 trillion to its balance sheet in 2020, some may be led to believe that the Fed has ‘run out of ammo’ in its fight against the fallout from the Great Lockdown.
The recent introduction of the Secondary Market Corporate Credit Facility (SMCCF) quickly debunks that notion, as the central bank begins “buying a broad and diversified portfolio of corporate bonds to support market liquidity and the availability of credit for large employers”.
Attempting to derive an adequate explanation of the recent contraction amounts to pure speculation, but the trend itself may continue to be an interesting dynamic as the US ‘recovery’ continues, with a sustained reduction in the Federal Reserve’s balance sheet possibly fuelling further risk aversion and downside for global equity markets.


EUR/USD Daily Chart – Price Perched at Key 61.8% Fibonacci Support

EUR/USD chart created using TradingView
The 61.8% Fibonacci retracement (1.1167) of the March range has halted EUR/USD four-day slide after price failed to close above the 2018 downtrend.
Despite the RSI surging into overbought territory price was unable to breach a familiar inflection point at the June 2019 high (1.1412) suggesting the exchange rate may have further downside to come.
Bearish bias may be reinforced by the development of the RSI and momentum indicators, as they snap their constructive uptrends from early March.
A relief rally may eventuate should price overcome resistance at the August 2019 high (1.1250) possibly carving a path back to the June high (1.1422), although recent price developments suggest this remains unlikely.
A close below the 61.8% Fibonacci may invigorate selling pressure, with a break of key support at the May high (1.1145) possibly seeing price fall back to the 200-MA (1.1058) and April high (1.1039)
-- Written by Daniel Moss
Follow me on Twitter @DanielGMoss


