


GOLD & CRUDE OIL TALKING POINTS:
- Gold price technical positioning hints a top may be taking shape
- Crude oil prices struggle at chart resistance as OPEC+ convenes
- S&P 500 futures hint at risk-on bias, EIA drilling report on tap
Gold prices edged up Friday as the US Dollar weakened and Treasury bond yields fell, boosting the appeal of anti-fiat and non-interest-bearing assets. Crude oil prices swung in a choppy range as OPEC+ officials prepared to meet in Baku, Azerbaijan to discuss progress on coordinated output cuts, with traders pondering the possibility that they might be extended past the current mid-year expiration date.
GOLD EYES RISK TRENDS, OIL FOCUSED ON OPEC+ MEETING & EIA REPORT
From here, a relatively quiet offering on the economic calendar may put sentiment trends at the forefront. A cautiously upbeat mood in Asia Pacific trade has nudged up bond yields alongside shares, pressuring gold downward. Bellwether S&P 500 futures are pointing gently higher, hinting that more of the same might be in the cards ahead. Follow-through may be limited ahead of Wednesday’s FOMC meeting however.
Meanwhile, oil traders will continue eyeing soundbites from Baku as supporters of extending supply caps – notably, Saudi Arabia – spar with skeptics like Russia and Iraq. Against this backdrop, the monthly EIA Drilling Productivity Report may show that US production continues to swell, threatening to derail OPEC-driven de-stocking efforts. That might weigh on prices.
Learn what other traders’ gold buy/sell decisions say about the price trend!
GOLD TECHNICAL ANALYSIS
Gold prices pulled back from support-turned-resistance in the 1303.70-10.95 area, with overall positioning hinting that a (somewhat malformed) Head and Shoulders top might be taking shape. Confirmation is required on a break of neckline support, now at 1281.91. If that is breached on a daily closing basis, the 1260.80-63.76 zone is exposed initially but the overall setup implies a measured downside objective near 1220. Alternatively, a move above 1310.95 sets the stage to revisit the February swing top at 1346.75.

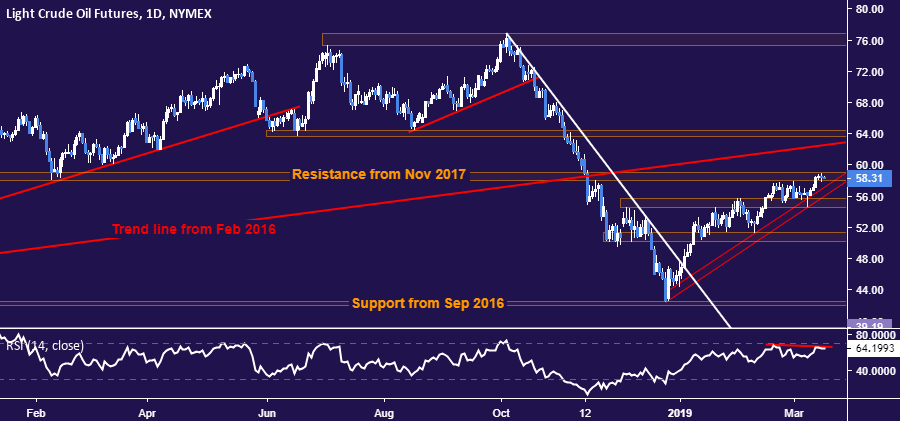
CRUDE OIL TECHNICAL ANALYSIS
Crude oil prices are testing resistance in the 57.96-59.05 area. Negative RSI divergence warns of ebbing upside momentum and hints a turn lower may be brewing ahead. Confirmation requires a daily close below the 54.55-55.66 support band, which would then expose the 50.15-51.33 zone. Alternatively, a push above resistance exposes the underside of former support set from February 2016, now at 62.63.
COMMODITY TRADING RESOURCES
- See our guide to learn about the long-term forces driving crude oil prices
- Having trouble with your strategy? Here’s the #1 mistake that traders make
- Join a Trading Q&A webinar to answer your commodity market questions
--- Written by Ilya Spivak, Currency Strategist for DailyFX.com
To contact Ilya, use the comments section below or @IlyaSpivak on Twitter


