


Asia Pacific Market Open Talking Points
- US and Canadian Dollars sink on softer economic data
- S&P 500 cleared key resistance, aiming for record highs
- Anti-risk Japanese Yen may weaken as Asia stocks rise
Find out what the #1 mistake that traders make is and how you can fix it!
Key FX Developments Friday
The US and Canadian Dollars were the worst-performing major currencies on Friday. Albeit, it was not by that much. Declines were due to softer-than-expected data. In the US, industrial production clocked in at 0.1% m/m in February versus 0.4% expected. In Canada, existing home sales slumped 9.1% m/m in the same month, much more severe than the 4.0% contraction expected and the sharpest since January 2018.
Weaker industrial production out of the US follows data tending to underperform relative to economists’ expectations since February. Front-end government bond yields in both the United States and Canada declined, signaling increasingly dovish monetary policy expectations (see immediate chart below). This seemed to also have an impact on equities.

Chart Created in TradingView
S&P 500 Technical Analysis
Yes, the S&P 500 rose 0.50% as it achieved its highest close since October 2018, but more importantly it just barely cleared critical resistance on the chart below at 2824. I am using futures as they offer a more liquid view with afterhours-trade. Confirming another close to the upside opens the door to testing record-highs set back in September before the notorious 20% correction that wiped out its upside progress last year.
Negative RSI divergence does show that upside momentum is fading, risking a turn lower in the near-term. That places support as a horizontal range between 2726.50 and 2743.75, which is the furthest the index got after the break under the rising wedge bearish reversal pattern. Clearing this area opens the door to testing 2695.50 thereafter.
S&P 500 Daily Chart

Chart Created in TradingView
Monday’s Asia Pacific Trading Session
Aside from a slew of Japanese economic data, which often has a minimal impact on USD/JPY, the docket is relatively light. This places the focus on risk trends. Asia Pacific benchmark stock indexes may echo the gains seen on Wall Street, especially as markets price in more dovish central banks. This week contains the Federal Reserve and Bank of England rate decisions. If this is the case early into the week, we may see the anti-risk Japanese Yen weaken while the pro-risk Australian and New Zealand Dollars push higher.
US Trading Session Economic Events

Asia Pacific Trading Session Economic Events
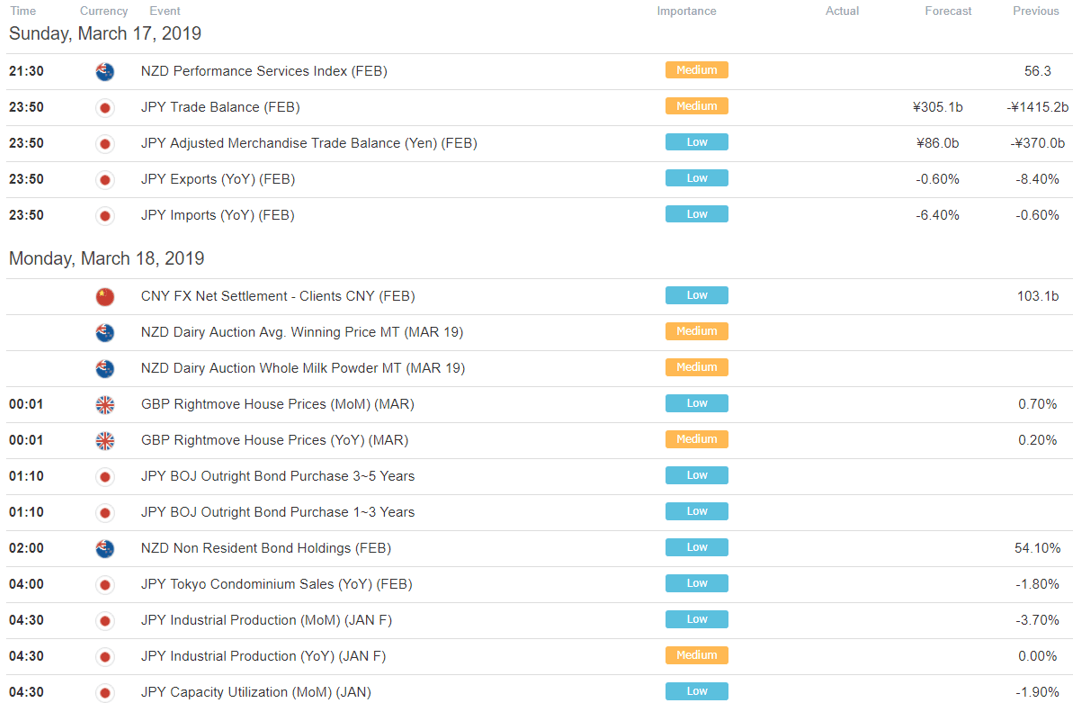
** All times listed in GMT. See the full economic calendar here
FX Trading Resources
- See how equities are viewed by the trading community at the DailyFX Sentiment Page
- Join a free Q&A webinar and have your trading questions answered
- See our free guide to learn what are the long-term forces driving US Dollar prices
- See our study on the history of trade wars to learn how it might influence financial markets!
--- Written by Daniel Dubrovsky, Junior Currency Analyst for DailyFX.com
To contact Daniel, use the comments section below or @ddubrovskyFX on Twitter


