


GOLD & CRUDE OIL TALKING POINTS:
- Gold prices stall at chart resistance as US Dollar gains in risk-off trade
- Crude oil prices down alongside stocks as sentiment cools market-wide
- S&P 500 futures suggest risk aversion still the path of least resistance
Gold prices struggled for direction as renewed risk aversion offered conflicting cues, with a supportive decline in yields offset by haven-seeking flows’ support for the US Dollar (as expected). Sentiment-sensitive crude oil prices offered a more straight-forward response, falling in lockstep with stocks.
GOLD RALLY STALLS, CRUDE OIL MAY FALL FURTHER IN RISK-OFF TRADE
Looking ahead, a meaningful downswing in bellwether S&P 500 futures in Asia Pacific trading hours hints the risk-off mood has scope to continue. That suggests yesterday’s moves may find follow-through, with oil under pressure while gold treads water.
API inventory flow statistics headline the data docket. The outcome will be measured against expectations predicting a 2.7-million-barrel build to be reported in official EIA figures due Wednesday. A larger rise may amplify sentiment-driven selling pressure on oil prices, while a smaller one helps mitigate it.
Learn what other traders’ gold buy/sell decisions say about the price trend!
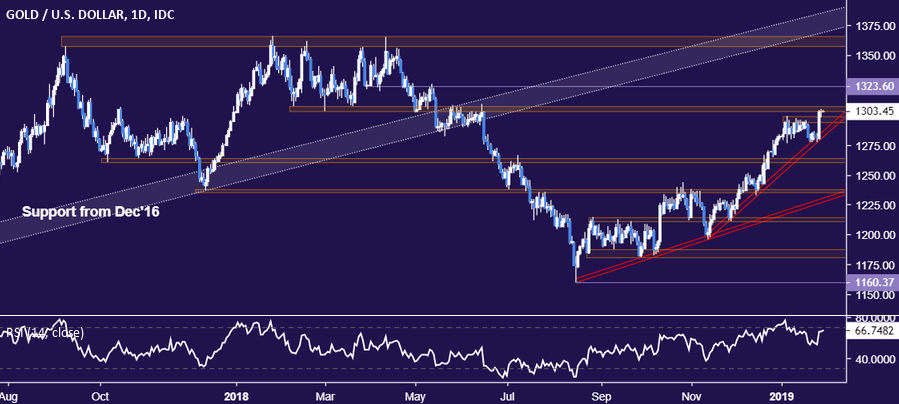
GOLD TECHNICAL ANALYSIS
Gold prices stalled at resistance 1302.97-07.32 area after Friday’s swift rally. A breach above this barrier confirmed on a daily closing basis exposes the chart inflection point at 1323.60 next. Alternatively, a reversal lower that takes out rising trend support at 1281.76 opens the door for test of the 1260.80-63.76 region.
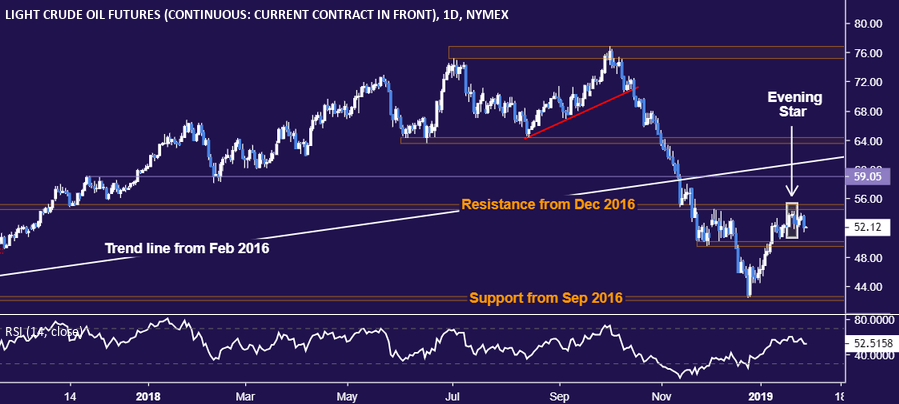
CRUDE OIL TECHNICAL ANALYSIS
Crude oil prices drop to issue to the lowest close in two weeks, hinting at follow-through on the bearish Evening Star candlestick pattern identified earlier. From here, a daily close below support in the 49.41-50.15 area sets the stage for a retest of the 42.05-55 zone. Alternatively, push above resistance in the 54.51-55.24 region aims for the chart inflection point at 59.05.
COMMODITY TRADING RESOURCES
- See our guide to learn about the long-term forces driving crude oil prices
- Having trouble with your strategy? Here’s the #1 mistake that traders make
- Join a Trading Q&A webinar to answer your commodity market questions
--- Written by Ilya Spivak, Currency Strategist for DailyFX.com
To contact Ilya, use the comments section below or @IlyaSpivak on Twitter


