


CRUDE OIL & GOLD TALKING POINTS:
- Crude oil price chart warns a turn lower may be brewing ahead
- Davos headlines, US PMI might inspire renewed risk aversion
- Gold prices clutching support, US Dollar trend may be decisive
Swings in broad-based risk appetite trends continued to define crude oil price action yesterday, with seesaw swings in the WTI benchmark matching those in S&P 500 futures yesterday, ultimately ending the session little-changed. Gold prices were likewise non-committal as bond yields gyrated, reflecting indecision on the sentiment front.
US PMI MAY COMPOUND WORRIES STOKED BY MOOD AT DAVOS
Looking ahead, January’s US PMI data is in focus. The release from Markit Economics will offer a welcome timely look at the business cycle as the government shutdown derails the usual flow of market-relevant statistics. Expectations point to modest slowing in manufacturing- and service-sector growth. US economic news-flow has narrowly underperformed relative to forecast recently, opening the door to disappointment.
Substantively softer outcomes may amplify global slowdown fears being concurrently articulated at the World Economic Forum ongoing in Davos, Switzerland. That may re-energize a concerted de-risking effort across financial markets, pushing oil down alongside shares. Gold may benefit as yields are pressured lower, but gains may be constrained if haven demand buoy the US Dollar.
See our guide to learn about the long-term forces driving crude oil prices !
GOLD TECHNICAL ANALYSIS
Gold prices continue to stall at rising trend line support set from mid-November. A break below this barrier – now at 1282.83 – targets the 1260.80-63.76 area next. Alternatively, a push above resistance at 1298.54,January 4 high, opens the door for a test of 1323.60.

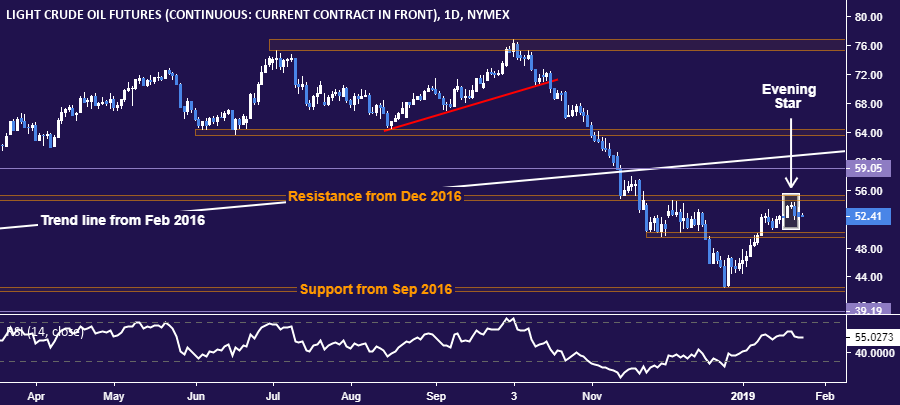
CRUDE OIL TECHNICAL ANALYSIS
Crude oil prices put in a bearish Evening Star candlestick pattern below resistance in the 54.51-55.24 area, hinting a turn lower may be ahead. A daily close below support in the 49.41-50.15 zone exposes the 42.05-55 region. Alternatively, a push above 55.24 paves the way for a test of a chart inflection point at 59.05.
COMMODITY TRADING RESOURCES
- Learn what other traders’ gold buy/sell decisions say about the price trend
- Having trouble with your strategy? Here’s the #1 mistake that traders make
- Join a Trading Q&A webinar to answer your commodity market questions
--- Written by Ilya Spivak, Currency Strategist for DailyFX.com
To contact Ilya, use the comments section below or @IlyaSpivak on Twitter


