


CRUDE OIL & GOLD TALKING POINTS:
- Crude oil prices drop to seven-month lows on oversupply worries
- Gold prices pause to digest gains after Thursday’s explosive rally
- US midterm elections may help US Dollar, hurt commodity prices
Crude oil prices fell for a fifth consecutive day on Friday as global oversupply fears remained at the forefront. News that the US has granted eight countries sanctions waivers, allowing them to continue imports from Iran, seemed to be the catalyst du jour. Gold prices marked time in the meantime, digesting the prior day’s aggressive rally.
CRUDE OIL, GOLD MAY FALL ON US MIDTERM ELECTIONS OUTCOME
Looking ahead, a light day on the economic calendar seems unlikely to drive meaningful trend development as all eyes turn to the outcome of US midterm elections on Tuesday. The baseline scenario envisions divided Congress after the votes are counted, with Democrats reclaiming a majority in the House of Representatives. That may boost the US Dollar, weighing on commodity prices by extension.
See our guide to learn about the long-term forces driving crude oil prices !
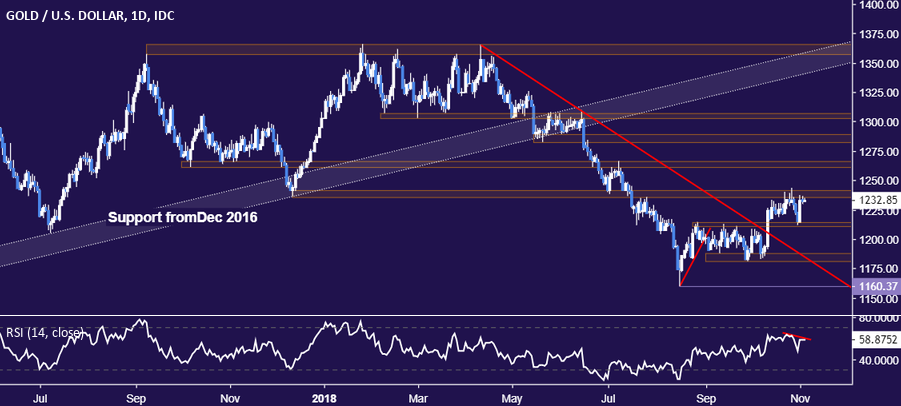
GOLD TECHNICAL ANALYSIS
Gold prices have stalled following a retest of resistance in the 1235.24-41.64 area. A break above this barrier exposes the 1260.80-66.44 region next. Alternatively, a reversal downward that produces a daily close below support in the 1211.05-14.30 band opens the door for a test of the 1180.86-87.83 zone.
CRUDE OIL TECHNICAL ANALYSIS
Crude oil prices sank to a seven-month low on their way to support at 61.84. A daily close below this barrier clears the way for a challenge of the $60/bbl figure. Alternatively, a reversal back above support-turned-resistance in the 64.26-45 area targets a falling trend line at 65.73.
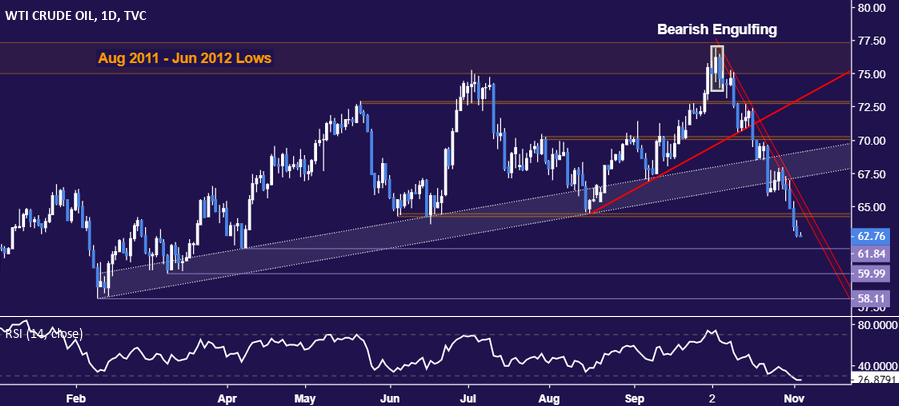
Turning to the weekly chart, prices are making headway on a longer-term reversal, as expected. From this perspective, the spotlight now seems to be on the $59/bbl figure. This is the site of a support line set from 2016. A close below that seems likely to pave the way for substantial further weakness to follow.

COMMODITY TRADING RESOURCES
- Learn what other traders’ gold buy/sell decisions say about the price trend
- Having trouble with your strategy? Here’s the #1 mistake that traders make
- Join a Trading Q&A webinar to answer your commodity market questions
--- Written by Ilya Spivak, Currency Strategist for DailyFX.com
To contact Ilya, use the comments section below or @IlyaSpivak on Twitter


