


Talking Points:
- Gold prices look to Fed interest rate hike path outlook for direction
- Crude oil prices may rise if EIA inventories data echoes API forecast
- What drives long-term crude oil price trends? See our guide here
Gold prices corrected a bit higher after yesterday’s aggressive selloff as markets set sights on the FOMC monetary policy announcement. The start of a modest “quantitative tightening” program seems all-but-certain at this point, with updated projections for the Fed interest rate hike path this year and through 2019 likely to be most market-moving.
The yellow metal may edge lower if June’s forecasts are kept steady despite the disinflation seen in the first half of the year. Needless to say, an upgrade of the 2018-19 bets – unlikely though it is – may lead to more dramatic weakness. A downgrade of the longer-term path seems to be status quo but if the call for a third hike in 2017 drops out of the outlook, a gold recovery is probable.
Crude oil prices continued to struggle for direction. The WTI benchmark drifted toward the bottom of its weekly range amid a dearth of potent catalysts but losses vanished after API reported that inventories added just 1.44 million barrels last week, the smallest gain yet this month. Traders may have interpreted the result as signaling that hurricane-induced disruptions in refinery uptake are fading.
Looking ahead, a meeting of technical committee monitoring compliance with the OPEC-led production cuts will take place in Vienna, with markets eyeing emerging commentary for signs that the scheme might be extended. Official EIA inventory statistics are also on tap. Forecasts envision a gain of 3.86 million barrels. A print closer to the API projection may prove modestly supportive.
See here what retail traders’ gold bets before the Fed rate decision say about the price trend!
GOLD TECHNICAL ANALYSIS – Gold prices paused to consolidate after breaking a two-month uptrend. Near-term support remains in the 1295.46-99.25 area (38.2% Fibonacci retracement, double top), with a break below that confirmed on a daily closing basis targeting the 50% level at 1281.26. Alternatively, a rebound above the 23.6% Fib at 1321.51 paves the way for another test of the 14.6% retracement at 1335.24.
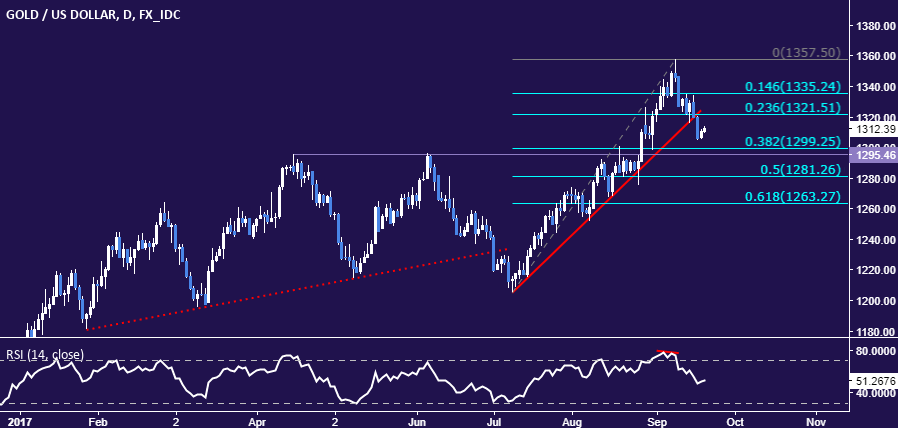
Chart created using TradingView
CRUDE OIL TECHNICAL ANALYSIS – Crude oil prices remain stuck near resistance at 50.40, the August 1 high. A break above this barrier confirmed on a daily closing basis exposes the May 25 top at 51.97. Alternatively, a reversal below trend line resistance-turned-support at 49.00 opens the door for retest of the September 11 low at 47.03.
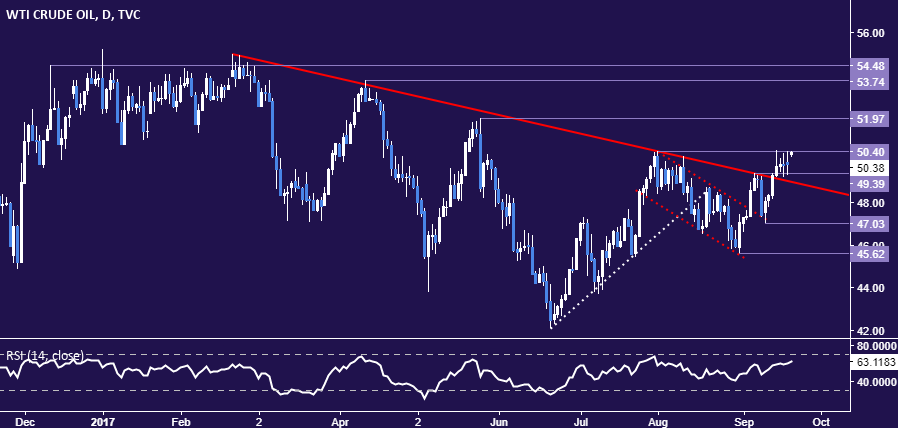
Chart created using TradingView
--- Written by Ilya Spivak, Currency Strategist for DailyFX.com
To receive Ilya's analysis directly via email, please SIGN UP HERE
Contact and follow Ilya on Twitter: @IlyaSpivak


