US STOCKS OUTLOOK:
- U.S. stocks plunge as consumer confidence falls to the lowest level since February 2021
- Nasdaq 100 leads losses on Wall Street, the S&P 500 re-enters bear market territory
- The ECB’s Forum in Sintra will be the center of attention on Wednesday
Trade Smarter - Sign up for the DailyFX Newsletter
Receive timely and compelling market commentary from the DailyFX team
Most Read: Gold Price Forecast - Gold Grinds into Quarter-End as the Big Move Awaits
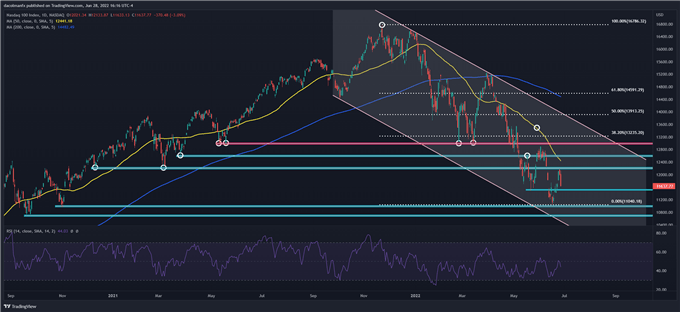
After a positive opening, U.S. stocks abruptly reversed course and sold off aggressively throughout the day, weighed down by disappointing macro-related data and growing concerns that the U.S. economy is headed for a hard landing. At the closing bell, the S&P 500 slumped 2.01% to 3,821, re-entering bear market territory. The Nasdaq 100, for its part, plunged 3.09% to 11,637, completely erasing Friday’s rally, signaling that there is little faith in the market’s ability to mount a meaningful rebound.
Today’s bearish price action can be attributed in part to deteriorating sentiment about the country's economic conditions amid red-hot and multi-decade high inflation. For context, earlier this morning the Conference Board said that U.S. consumer confidence sank 4.5 points to 98.7 in June, reaching its lowest level since February 2021, indicating slower growth for the second quarter and an increasing risk of recession by the end of the year. This assessment makes sense considering that household spending accounts for roughly two-thirds of U.S. GDP.


Heading into this week, there was speculation that pension fund end-of-quarter rebalancing activity would boost demand for stocks and drive their prices higher in the coming sessions, but those expectations have not materialized, at least as of Tuesday. While we could still see a rally toward the final days of the month, the mood on Wall Street is quickly souring, suggesting that investors may not be willing to take on additional risks until the investment environment improves.
Looking ahead, there are several high-impact events on the calendar that could spark volatility and that should be watched closely. On Wednesday, for example, traders should keep an eye on the ECB's Central Banking Forum in Sintra, Portugal, where key individuals, including Fed Chairman Jerome Powell, could offer remarks on the outlook. Hawkish comments are likely to bolster selling interest, while dovish remarks could be bullish for stocks.


NASDAQ 100 TECHNICAL ANALYSIS
Despite last week’s strong upswing, the Nasdaq 100 was unable to overcome key resistance near 12,175/12,225. After testing that area early Monday, sellers resurfaced and pushed the index lower, paving the way for a brutal sell-off in the ensuing session. With the latest moves, the Nasdaq 100 is steadily approaching an important technical support near 11,500. If this floor is breached in the coming days, traders should prepare for the possibility of a retest of the 2022 lows. On the flip side, if downside pressure abates and buyers manage to trigger a bullish reversal, initial resistance is found at 12,175/12,225, followed by the 50-day simple moving average. On further strength, the focus shifts higher to 12,600.
NASDAQ 100 TECHNICAL CHART


