


Gold Talking Points:
- Gold prices have been mean-reverting over the past six weeks with little directional pull.
- Bigger picture, Gold prices have been in a much larger range for almost two years, with the Fibonacci retracement from that move helping to define a number of inflection points.
- The analysis contained in article relies on price action and chart formations. To learn more about price action or chart patterns, check out our DailyFX Education section.

Gold prices remain range-bound and this statement can span across timeframes. There’s a much larger range that’s built over the past two years that remains in-effect but there’s more than $400 of distance between support and resistance, making it somewhat usable to swing traders. But, on a shorter-term basis, there’s even more grind with an even tighter range as Gold prices have spent most of the past six weeks between 1804 and 1881.
Gold Price Eight-Hour Chart
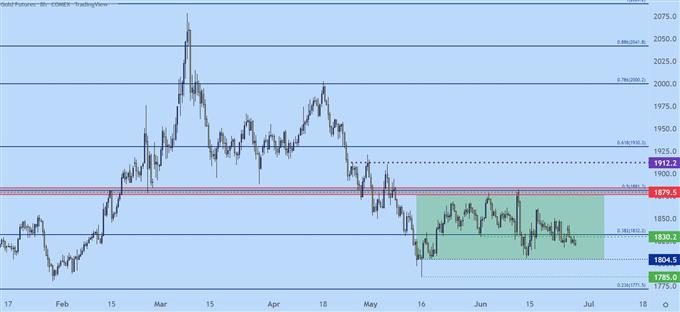
Chart prepared by James Stanley; Gold on Tradingview
Taking a step back to provide some context, we can see where this range is holding after a resistance inflection at the 50% mark of the longer-term range, which was defined by the pullback from all-time-highs into early 2021.
The 38.2% Fibonacci retracement of that move has also been quite active, previously helping to set support before last week closed below that level, with a bit of continued drift so far this week.

Gold Weekly Price Chart
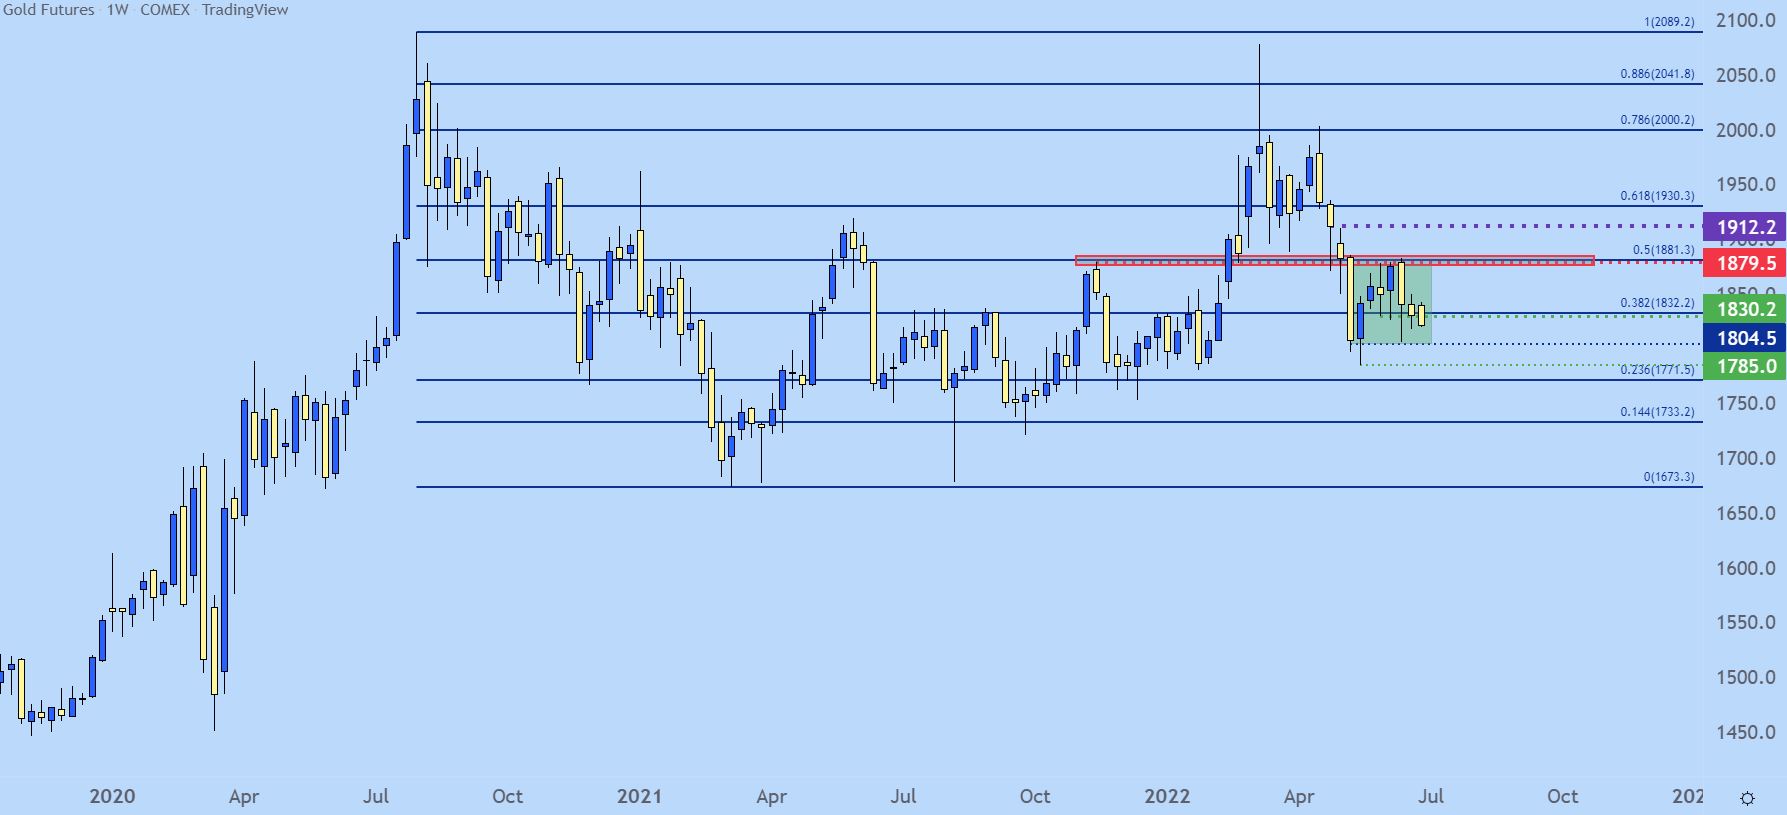
Chart prepared by James Stanley; Gold on Tradingview
Gold Strategy
At this point, traders with a longer-term horizon on Gold have two options: Either operate inside of the range or wait for it to finally give way. There’s a plethora of data on this week’s economic calendar so perhaps something happens there, but given the technical backdrop there’s no signs yet of a directional move brewing.
But, for those combining some fundamentals into the mix as rate hikes remain a primary push point, there could still be a remaining bearish lean in here and for those looking to fill that narrative with short-term techs, there could be some potential there.
From the two-hour chart below, we can see a descending triangle-like formation brewing, with a series of lower-highs to go along with horizontal support around the 1816-1820 zone. This can keep the door open to bearish themes, looking for prices to push down towards that 1809 level, and if that comes into play, there’s the possibility of a drop down to the 1804 level which puts the longer-term range in focus.
Gold Two-Hour Price Chart
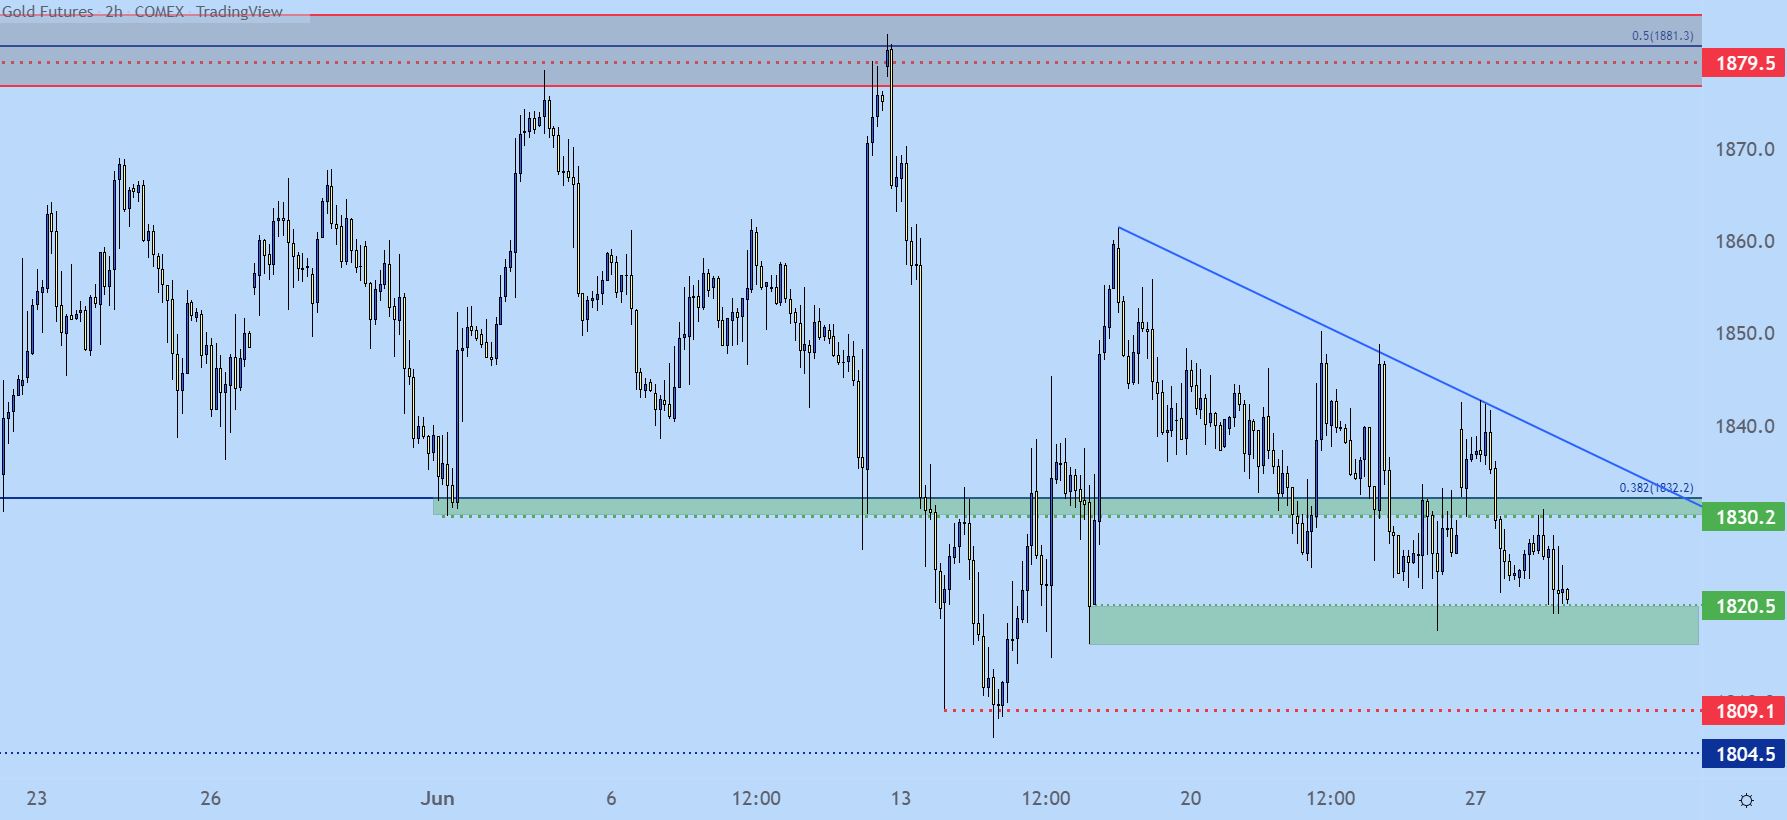
Chart prepared by James Stanley; Gold on Tradingview
--- Written by James Stanley, Senior Strategist for DailyFX.com
Contact and follow James on Twitter: @JStanleyFX


