


NORDIC FX, NOK, SEK WEEKLY OUTLOOK
- USDNOK traders tense up ahead of major cross point
- USDNOK testing key support strength in trading range
- USDSEK may experience pullback before resuming uptrend
See our free guide to learn how to use economic news in your trading strategy !
USDNOK TECHNICAL ANALYSIS
USDNOK broke below the lower lip of the 8.6937-8.7883 range (solid yellow lines), and meaningful follow-through could be a major risk and could usurp optimism over the pair’s upward trajectory. The rising support (red parallel channel) has been active for over 14 months. A break below this with follow-through would mark a significant turn for the pair’s movement.
USDNOK – Daily Chart
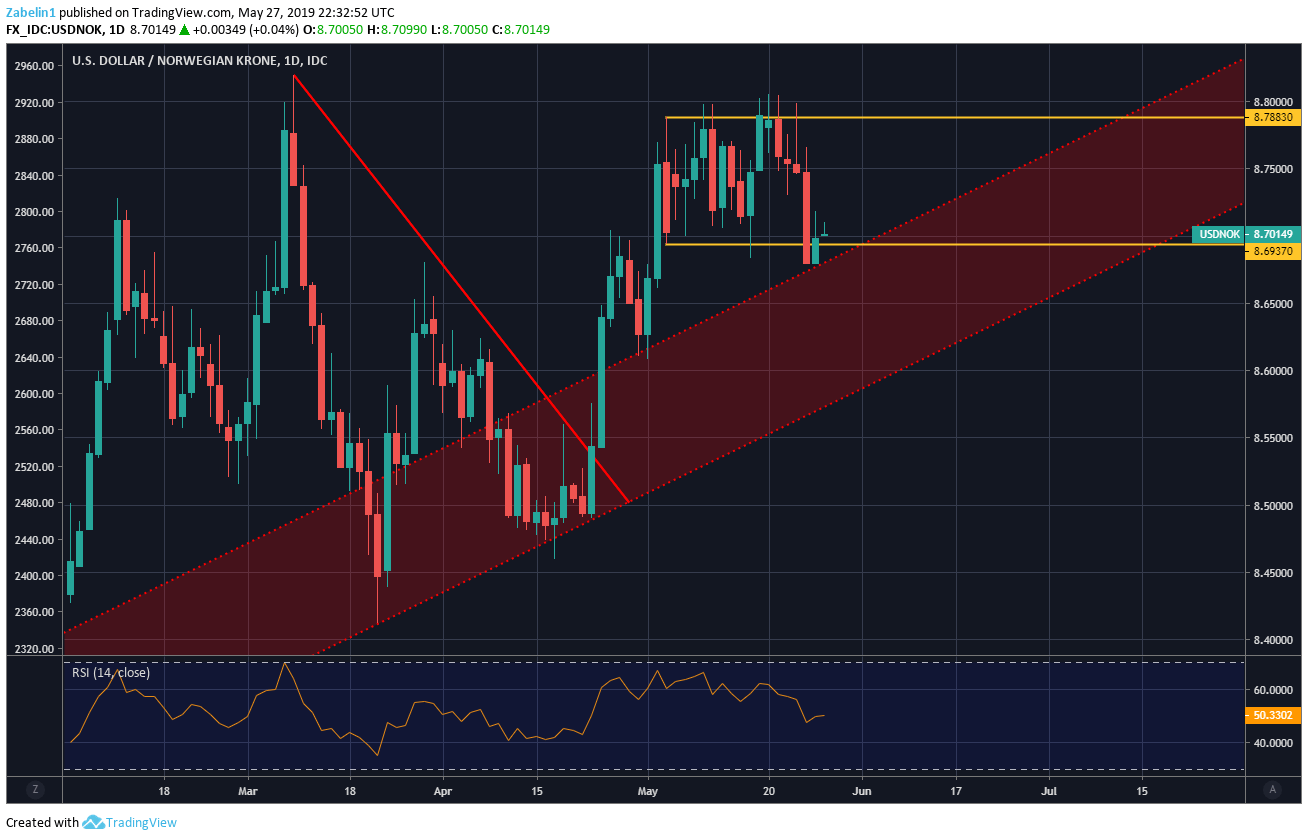
Despite USDNOK coming dangerously close to breaking below the over-one year rising support, the pair appear to be determined to continue higher. This comes despite a comparatively more hawkish outlook from the Norges Bank relative to the Fed. Unless the pair break below this upward-sloping support with follow-through, the current trajectory is expected to continue at least until year-end.
USDNOK – Weekly Chart

Want to know what are the fundamental themes driving Swedish Krona and Norwegian Krone price action? Follow me on Twitter at @ZabelinDimitri to keep up to date on all-things Nordic.
KRONA TECHNICAL ANALYSIS
USDSEK appears to be retreating from the sugar high it experienced in late April when the pair jumped approximately 2.5 percent. The break above resistance at 9.3110 (solid red line) with follow-through marked a significant bullish landmark as USDSEK continued to trade at a 17-year high. However, the pair may have now found a new temporary range between 9.5323-9.5767 (red dotted parallel lines).
USDSEK – Daily Chart
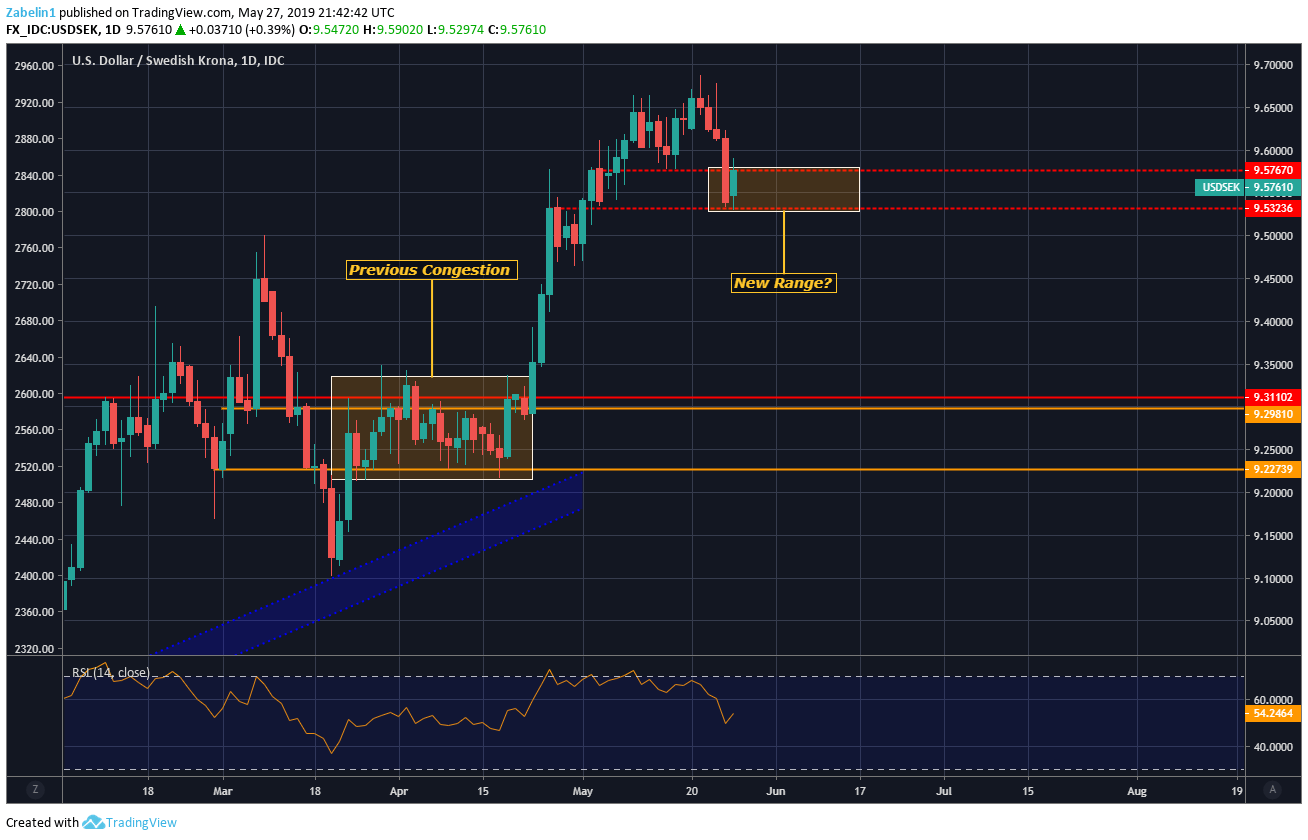
The prospective congestion may be a repeat of what had occurred earlier in the year when the pair spiked, cooled and traded sideways before resuming its broad uptrend. The period of relatively-lateral price movement could be thought of as a digestive interim where market participants take a moment to reevaluate their position and determine if the prevailing trend will continue along its current trajectory.
A monthly chart shows the uptrend has continued along its steep incline since January 2018. The prevailing trend will likely continue and will be supported by fundamental tailwinds that will put a premium on liquidity and a discount on risk. In this environment, the almighty US Dollar’s unparalleled liquidity will redirect capital away from risk-oriented assets like the Swedish Krona.
USDSEK – Monthly Chart

SWEDISH KRONA, NORWEGIAN KRONE TRADING RESOURCES
- Join a freewebinar and have your trading questions answered
- Just getting started? See our beginners’ guide for FX traders
- Having trouble with your strategy? Here’s the #1 mistake that traders make
--- Written by Dimitri Zabelin, Jr Currency Analyst for DailyFX.com
To contact Dimitri, use the comments section below or @ZabelinDimitri on Twitter


