


Stock Market Talking Points:
- The S&P 500 has a list of favorable statistics behind it as traders enter the long holiday weekend
- Since 1989, the S&P 500 has – on average – finished higher 60% of the time in the month after Easter
- Concerned about the quarter ahead? Check out our free Second Quarter Equity Forecast along with outlooks for the US Dollar, Gold price and more
History Suggests the Stock Market Will Climb in the Weeks After Easter
After the S&P 500 posted its largest first quarter return since 1998 at the end of March, many market participants were skeptical the rally could continue. Now that the index is within 2% of all-time highs, investors are wary of another stock market crash with February and October 2018 fresh in their minds.
Thankfully for bulls, the near record-breaking first quarter may have set the index up for success.
S&P 500 First Quarter Returns
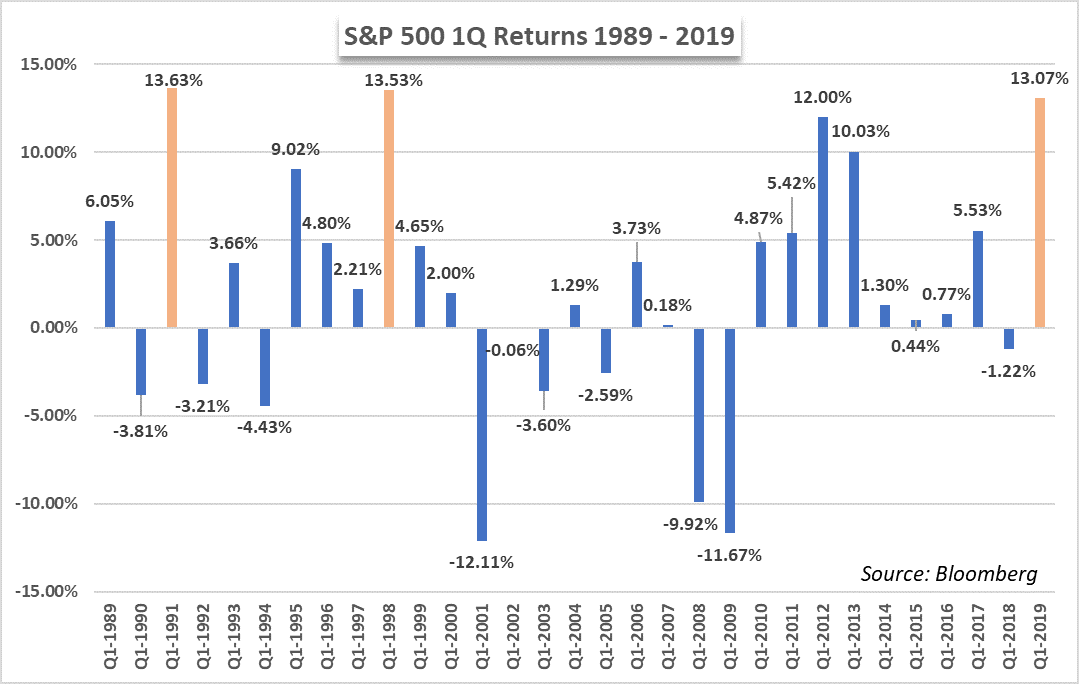
Apart from 1Q 2019, there have only been two other first quarters in the last 30 years that have returned higher than 13%. The first quarter of 1991 is one such instance and offered the largest first quarter return for the index since 1989. In the following three quarters, the S&P 500 climbed another 10.95% with an average quarterly return – excluding 1Q - of 3.65%. In total, the S&P 500 boasted a 24.58% return heading into 1992.
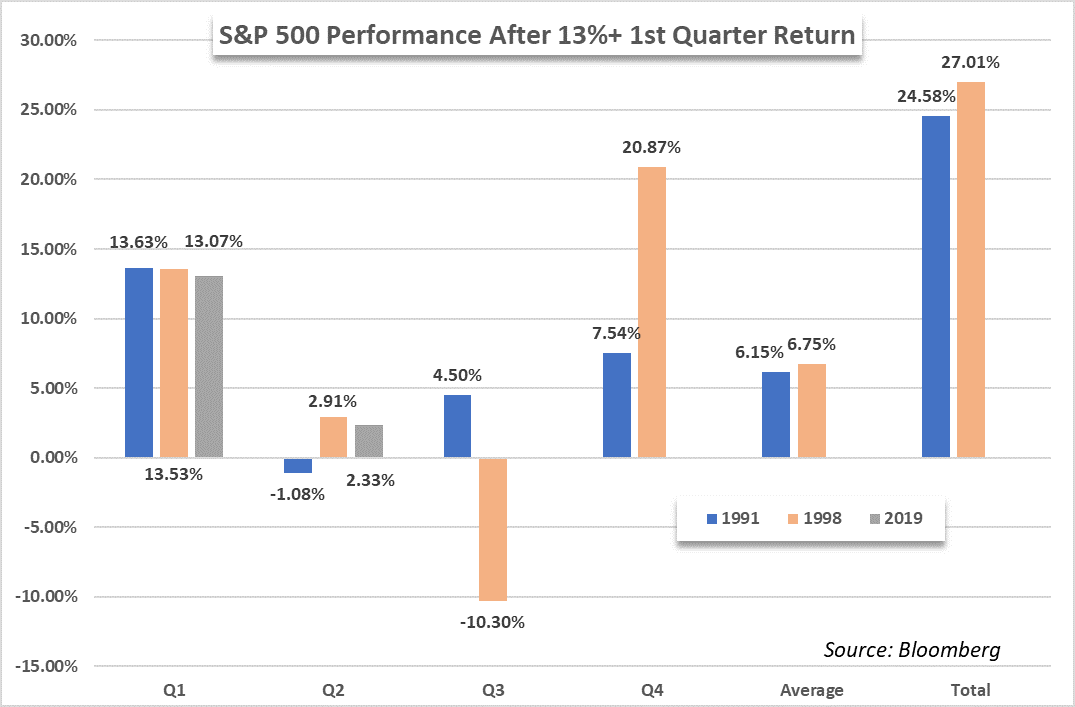
1998’s first quarter narrowly missed the return in 1991 but would eventually surpass the annual return offered in 1991. From the beginning of the second quarter to the end of 1998, the S&P 500 climbed 13.48% - with an average quarterly gain of 3.49% and an absolute average of 11.36%. Including the historically strong start to the year, the index ended 27.01% higher than it opened that year.
To expand the data set, average quarterly returns following a first quarter return above 10% are good for a 3.07% gain. While not quite as robust, an important takeaway is that every year with a first quarter return above 10% has closed higher for the year and higher than the end of the first quarter- suggesting the year’s strength was somewhat widespread.
Use IG Client Sentiment Data to gauge how retail traders are positioned on the S&P 500, Dow Jones, Gold and more.
If the S&P 500 is to follow in the footsteps of history, it could bear to lose around 2.3% before the year is over and still maintain the trend from 1989. But if bulls intend to keep pace with the average Q2-Q4 growth following years with first quarter growth above 10%, the index will need to grow another 8.4% before 2019 concludes.
S&P 500 Returns Following Easter Sunday
Such a pace will be difficult to maintain, especially with heightened recession fears and signs that the index is petering out near prior tops. However, if history is any indication, the weeks following Easter Sunday may serve to reignite the S&P 500’s rally.
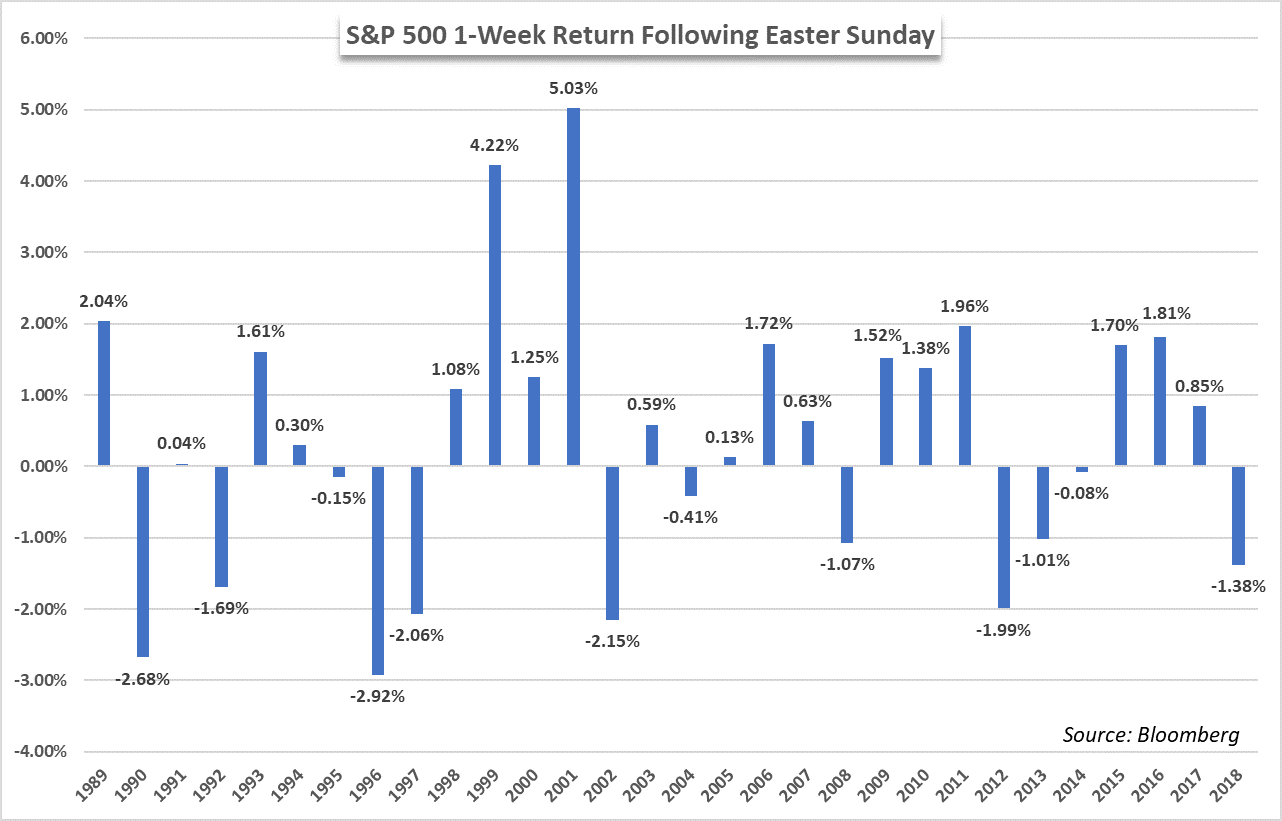
Return calculated from Holy Thursday’s closing price to closing price of following Friday
Since 1989, the S&P 500 has seen a positive return during the week following Easter Sunday in 18 of 30 (60%) instances - good for an average weekly return of 0.34%. The week of Easter Monday in 2001 offered the highest return in that timeframe - well above the absolute average move of 1.51%. Similarly, the month following Easter has also offered positive returns for the S&P 500 on average.
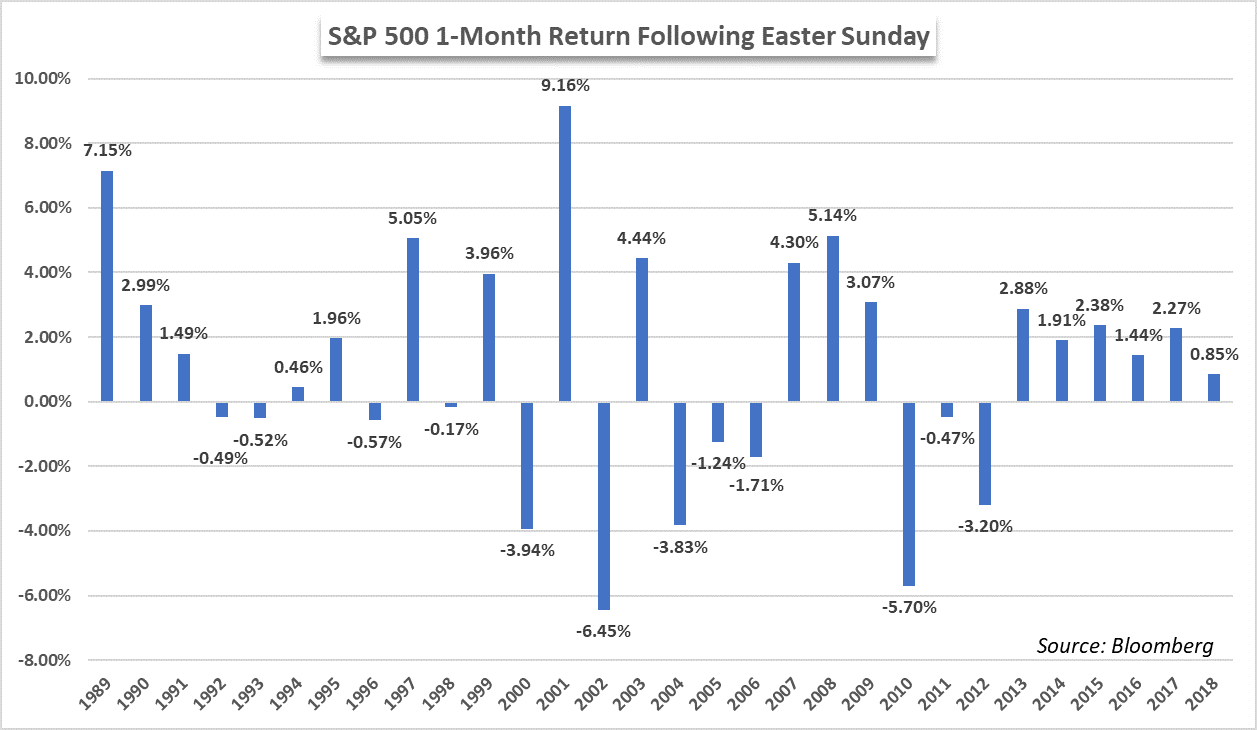
Return calculated from Holy Thursday’s closing price to the S&P 500’s closing price four Friday’s later
In the four weeks following Holy Thursday’s close, a familiar 60% of instances witnessed growth, including six consecutive years. That said, the variability of returns is understandably greater. On average, the S&P 500 grew 1.09% in the month following Easter, with an average absolute change of 2.97%.
As traders head home for the holiday weekend, the historical performance of the weeks ahead offers a glimmer of hope for continued equity strength in 2019. While past performance is by no means indicative of future results, a statistical observation of the weeks ahead favors the bull.
--Written by Peter Hanks, Junior Analyst for DailyFX.com
Contact and follow Peter on Twitter @PeterHanksFX
Read more: Netflix Stock Price Slides After Earnings, S&P 500 Sentiment Dented
DailyFX forecasts on a variety of currencies such as the US Dollar or the Euro are available from the DailyFX Trading Guides page. If you’re looking to improve your trading approach, check out Traits of Successful Traders. And if you’re looking for an introductory primer to the Forex market, check out our New to FX Guide.


