


Stock Market January Effect - Talking Points
- Statistically, US equities post gains in January on average
- Numerous risks still lurk in the background posing major headwinds to stocks
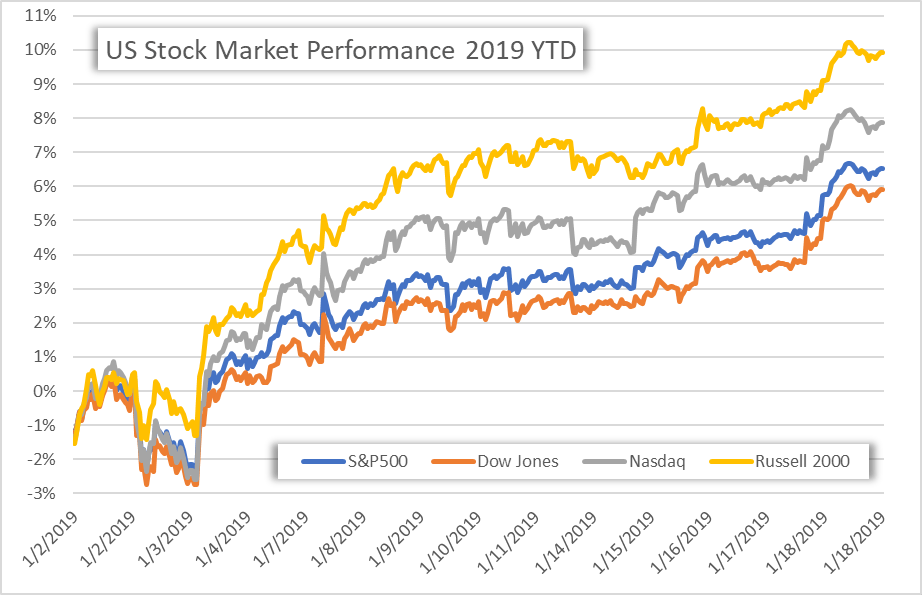
The stock market is having a stellar 2019 so far with the major US equity indices already pacing healthy gains through January. The S&P500, Dow Jones, Nasdaq and Russell 2000 have all risen as much as 6 to 10 percent after the first 13 trading days of the year.
US S&P 500, DOW JONES, NASDAQ, AND RUSSELL 2000 INDEX PRICE CHART: 15-MINUTE TIMEFRAME (DECEMBER 31, 2018 TO JANUARY 18, 2019)
Strong performance in January is not uncommon for stocks. In fact, the investment industry has coined this phenomenon the “January Effect” as equities tend to finish positive after the first month of the year more often than not. The January Effect is one of several stock market anomalies – or irregularities – that tend to occur time and time again. Examples of other anomalies that exist across the investment industry include “Sell in May and Go Away” and the “Santa Claus Rally” in December.
WHAT IS A STOCK MARKET ANOMALY?
A stock market anomaly is an ‘exceptions to the rule’ that is the Efficient Market Hypothesis (EMH). EMH states that assets should always trade at their intrinsic fair value. Under this assumption, the potential for consistent gains across capital markets is eliminated as in theory traders should not be able to buy securities that are undervalued or sell those that are overvalued. Consequently, trading strategies like the January Effect that historically produce consistent positive returns capitalize on an inefficient market and are thus deemed anomalies to the EMH seeing that it is an “exception to the rule.”
WHAT CAUSES THE JANUARY EFFECT?
There are numerous theories attempting to explain why the January Effect occurs, but tax-loss harvesting and investor psychology are among the most popular reasons. At the end of a year, it is common for retail investors and professional money managers to realize investment losses which reduces their taxable income. Often referred to as window-dressing, this cleans up the portfolio for year-end reporting by cutting losses and poor performers thus improving perceived performance.
When the new year rolls around, however, this tends to result in significant amounts of cash on the sidelines waiting to be put back to work in the market. This can contribute to a sizeable influx of cash from buyer demand at the beginning of the year that helps to lift share prices. As for investor psychology, an econometric report in the Financial Analysts Journal published by the CFA Institute concludes that the “anomalous buying and selling behavior of individual investors at the turn of the year” remains a plausible factor that persistently causes a positive effect on stock returns in January. It is suggested that behavioral explanations such as a general increase in appetite for risk and optimism or tactical dollar cost averaging investment decisions that are regularly made at the start of the year can further contribute to positive returns in the month.
US S&P500, DOW JONES, NASDAQ COMPOSITE, AND RUSSELL 2000 INDEX STOCK RETURNS DURING JANUARY PRICE CHART: ANNUAL TIME FRAME (1979 TO 2019)
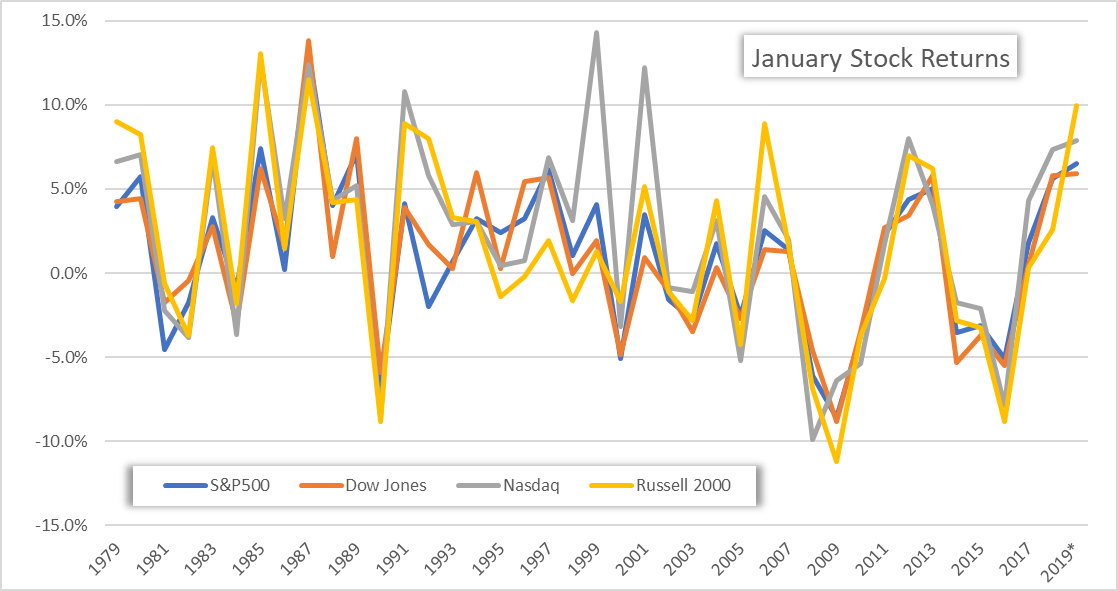
Dating back to 1979, index returns over the month of January for the S&P500 and Dow Jones are positive 63 percent of the time while the Nasdaq and Russell 2000 are positive 66 and 56 percent of the time respectively. Furthermore, the major US equity indexes generate a 1 to 2 percent return on average with returns ranging as high as a 14 percent gain to as low as an 11 percent loss over the period.
WHAT DOES THIS MEAN FOR STOCKS NOW?
It is important to understand that an investment strategy that has been profitable in the past does not mean it will be in the future since past performance is not indicative of future results. That being said, investment decisions should always be made in context of
the current macroeconomic environment. Out of the 26 years that the S&P500 finished the month of January in the green since 1979, there were only 4 observations where the equity index finished lower on an annual basis after a positive start through the opening month.
While stocks have been on a steady ascent since the start of the new year, looking at equity performance over the prior 3 months brings a different picture to light. The world stock market experienced a dramatic drop since peaking in September last year as a plethora of risks including a slowdown in global growth, tightening financial conditions and political instability dominate investor sentiment.
WORLD STOCK MARKET INDEX PRICE CHART: DAILY TIMEFRAME (SEPTEMBER 2018 TO JANUARY 2019)
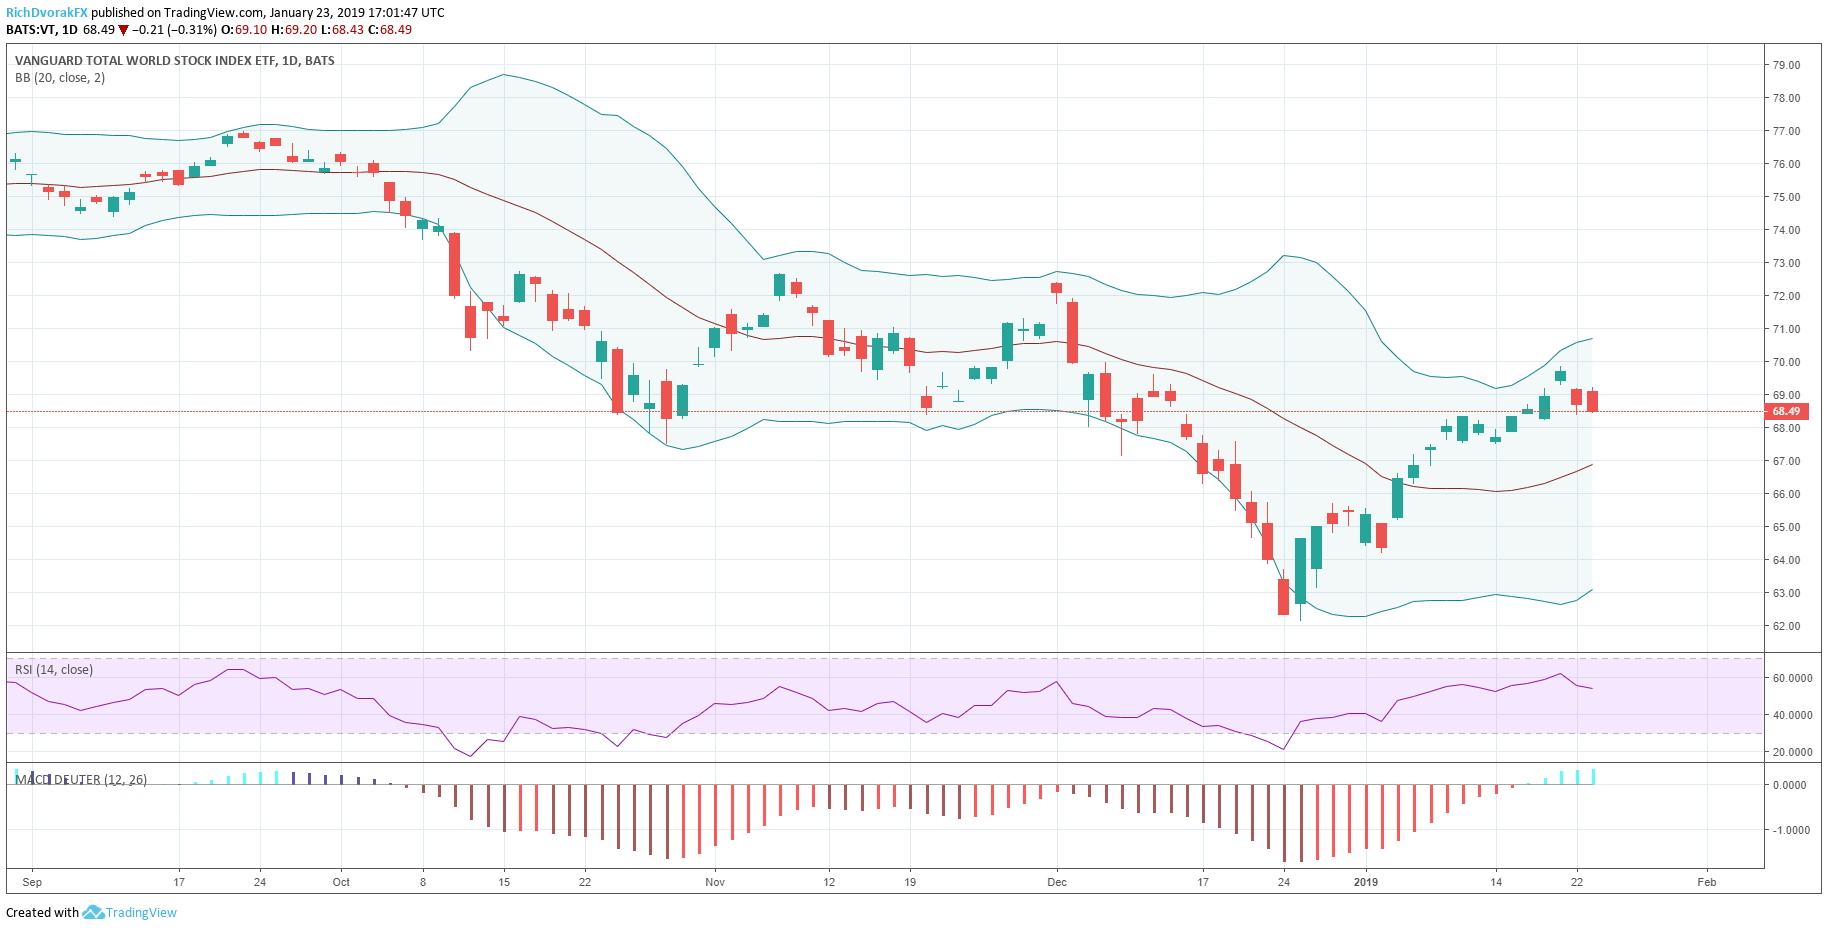
A deteriorating fundamental backdrop sent equities into a bear market as several GDP forecasts have been lowered in addition to several downward revisions to corporate earnings estimates. But, risk assets have quickly recovered as political leaders - namely Federal Reserve officials and President Trump’s trade team - rush to stabilize their faltering economies and instill confidence back into the markets.
This has been accomplished by central bankers walking back their hawkish stance on monetary policy and the White House pushing out jawboning US-China trade war remarks. While this has helped boost stocks off their recent low clocked on Christmas Eve, little has changed – let alone improved – from a fundamental standpoint. Notwithstanding the healthy gains witnessed over the last 4 weeks of trading, numerous risks still lurk in the background that pose major headwinds over the short term until they are either resolved or subside.
---
Written by Rich Dvorak, Junior Analyst for DailyFX
Follow on Twitter @RichDvorakFX
Check out our Education Center for more information on Currency Forecasts and Trading Guides.


