


Recession Talking Points:
- US markets were closed Monday, and this regional curb on liquidity had a clear impact on global risk trends
- Chinese 4Q GDP slowed - as expect - to its weakest pace in 28 years, and the US President had something to say about it
- Prime Minister May's Plan B for Brexit met a very cool reception, the January 29 vote gives little time to deal
What are the DailyFX analysts' top trading ideas for 2019 and key lessons to take away from 2018? Sign up for both on the DailyFX Trading Guides page.
China GDP, IMF Downgrade and UN Investment Report Offer a Clear Weather Map
There are very serious headwinds facing the global economy and markets - some incidental and natural, others man-made. The weight felt in the Chinese data Monday morning was a combination of both. The docket was thick with noteworthy indicators including jobs, retail sales and fixed investment (with a few positive highlights like factory output and service sector activity); but the real interest was in the 4Q GDP reading. The actual figure met expectations, as Chinese data tends to do, but the implications of the world's second largest economy slowing to its most restrained pace of expansion (6.4 percent) since 1990 is hard to de-emphasize. The trade war factor was clear here, and US President Donald Trump took the occasion to troll his Chinese counterpart suggesting this economic report was evidence of the impact that the economic conflict was having and that it should prompt the country to compromise. This wasn't the only evidence of the scourge that trade troubles were having. The IMF downgraded its GDP forecast for the second time since its October forecasts, this time seeing global expansion of 3.5 percent (0.2 percentage points lower) in 2019 and 3.6 percent (0.1 percent point lower) in 2020. They would also draw the connection in economic health to risk trends. Then there was the far less-covered UN fixed direct investment report for 2018. According to the group's assessment foreign global investment plunged 19 percent (1.2 trillion) in part by trade barriers but also by the US tax reform which encouraged fund repatriation.
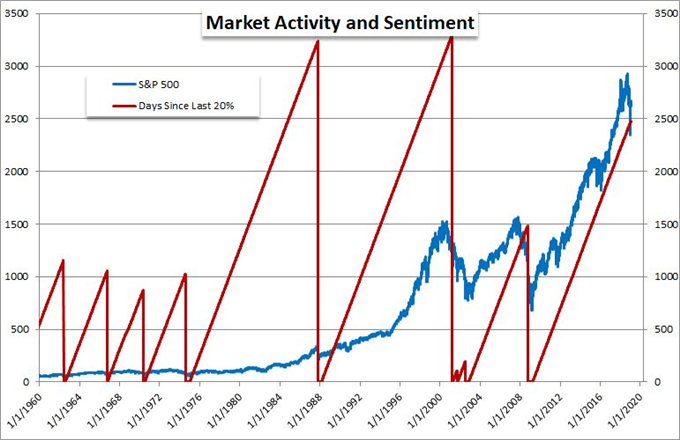
Chart of S&P 500 and Days Since Last Bear Market
Now, Risk Trends Can Give Us Their Real Take
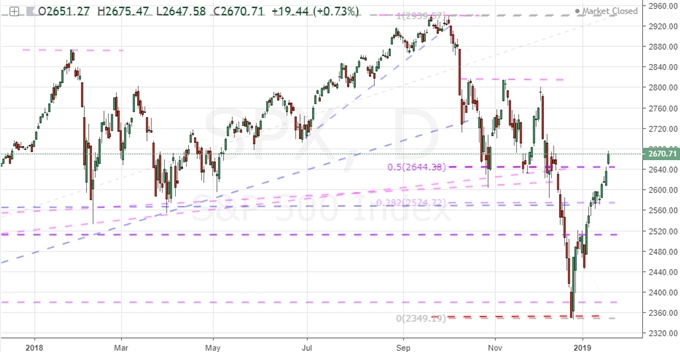
As heavy as the systemic updates were to start this trading week, the markets remained surprisingly sanguine. That is little comfort for a few reasons. First, the markets preceding this event were clearly tuned to a strong bullish signal - therefore dithering would be a significant downgrade in the blind enthusiasm of complacency. More remarkable though in my estimation is the drain on liquidity. While the US markets were the only major hole in global turnover, its absence is felt more profoundly than others. Rather than just its clout as the world's largest market and economy, the speculative sway from the country tends to originate a lot of the unorthodox speculative charge. We should therefore expect a more earnest assessment of how the milestones of economic struggle are impacting traders in the upcoming New York session open when it collides with afternoon/evening European liquidity. At stake is the extraordinary rally the S&P 500 has mounted up through Friday - earning a break above the mid-point to the October-December collapse that pushed the market nearly into an official 'bear' designation. As we suss out appetite and intent, make sure to register the under- or out-performance of other risk-leaning assets. For example, the emerging markets assets (shares, bonds, currencies) can speak to complacency picking up on other themes like hope for more stimulus. That would not be a permanent fix for sentiment bulls, but it can tell us full deleveraging is still a ways away yet.
Chart of the S&P 500 (Daily)
UK PM May's Plan B Doesn't Reassure a Brexit Solution is At Hand
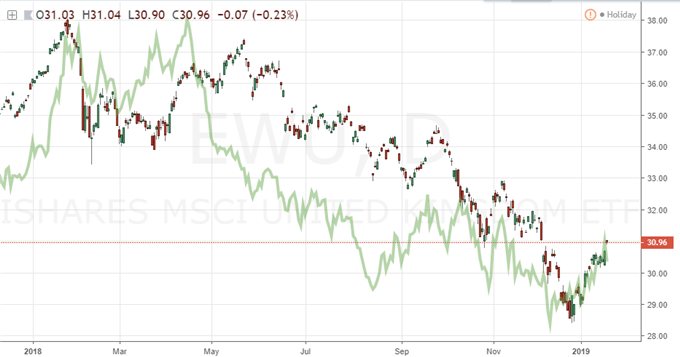
Aside from China's troubled economic activity update, the most concentrated headlines to cross the wires Monday were centered on Brexit. Prime Minister Theresa May had to offer up her Plan B proposal after her first effort was roundly rejected (in a record-breaking defeat) last week. The shortened time frame was the by-product of a Parliamentary vote not long ago meant to pass the block that the PM was making by refusing to entertain other options. With so little time, there was unsurprisingly little material difference in what she would propose versus last week. She vowed to be more flexible; but she would also refuse to take a 'no-deal' outcome off the table, rejected an extension of Article 50's March 29 deadline and wouldn't entertain a second referendum. Now, this gives Parliament until January 29th to debate the issue before it is put up to vote. It is likely that May will scramble to secure further accommodation from her EU counterparts between now and then, but the chances of something material enough are small. Watch for breaking headlines on the matter between now and next Tuesday. If nothing moves, it is likely that the process may be wrested slowly away from May. Through this, chances of volatility with little capacity for trend remain the order; but after, we might finally start to find traction.
Chart of MSCI IShares United Kingdom ETF Overlaid with GBPUSD in Green (Daily)
Euro Weighs Confidence, Kiwi Inflation, Yen Monetary Policy and Loonie Risk Trends
Looking to other major currencies, one major seems unlikely to generate much traction of its own unless a systemic theme hits an underlying risk nerve: the US Dollar. Its role as a carry currency and ultimate safe haven remains confused. Other issues seemed to be borne by community (trade wars) and standard data continues to be pushed back to an unknown release owing to the government shutdown. Perhaps a stronger counterpart can earn a bigger Greenback reaction. For the Euro, warnings of economic trouble from Germany to Italy should put greater emphasis on the Euro-area investor sentiment surveys from ZEW. Given the data and warnings releases recently, a steady bearing will read more like complacency. The Japanese Yen is heading into high profile event risk in both the trade report and Bank of Japan (BOJ) rate decision due early Wednesday morning/late Thursday. They will not likely move the currency so thoroughly tied to its role as a funding currency, but there is always the possibility of surprise. A targeted potential exists with the New Zealand Dollar, which will process 4Q CPI data to gauge the probability of an eventual RBNZ rate hike...or whether that will turn to an eventual cut. Even the Canadian Dollar (Loonie) is looking interesting technically with an unmistakable correlation to crude oil which is in the early phase of recovery. That said, the energy product is just as readily tied to risk trends like that shown in the S&P 500 - and so it seems everything traces back to sentiment: bullish or bearish, committed or adrift. We discuss all of this and more in today's Trading Video.
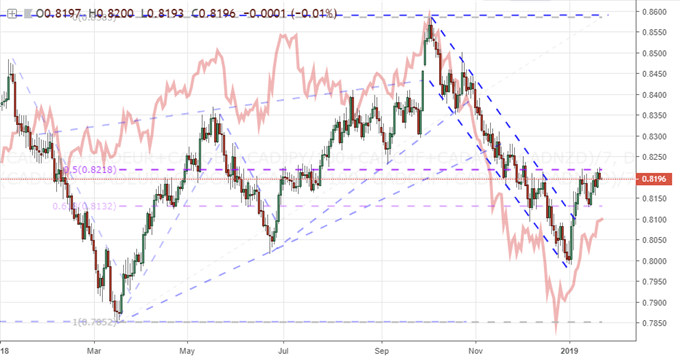
Chart of Canadian Dollar Equal Index Overlaid with Crude Oil in Red (Daily)
If you want to download my Manic-Crisis calendar, you can find the updated file here.


