


Fundamental Forecast for Oil: Neutral
Talking Points:
- DailyFX Q1, 2018 Forecasts: USD, Oil and Equities.
- Crude Oil, Gold Price Rebound May Fizzle on UK and US GDP Data.
- Are you looking to improve your trading approach? Check out Traits of Successful Traders. And if you’re looking for trade ideas, check out our IG Client Sentiment.
It was another strong week for Oil prices, as both West Texas Intermediate and Brent Crude worked-up to fresh three-year highs. This continues the bullish move that’s been seen in both markets since June of last year, amounting to a 61% incline in Brent and a 58% pop in WTI from the June, 2017 lows up to the new highs established earlier this week.
WTI Oil Prices Since 2014, Nearing 50% recovery of 2014-2016 Sell-Off
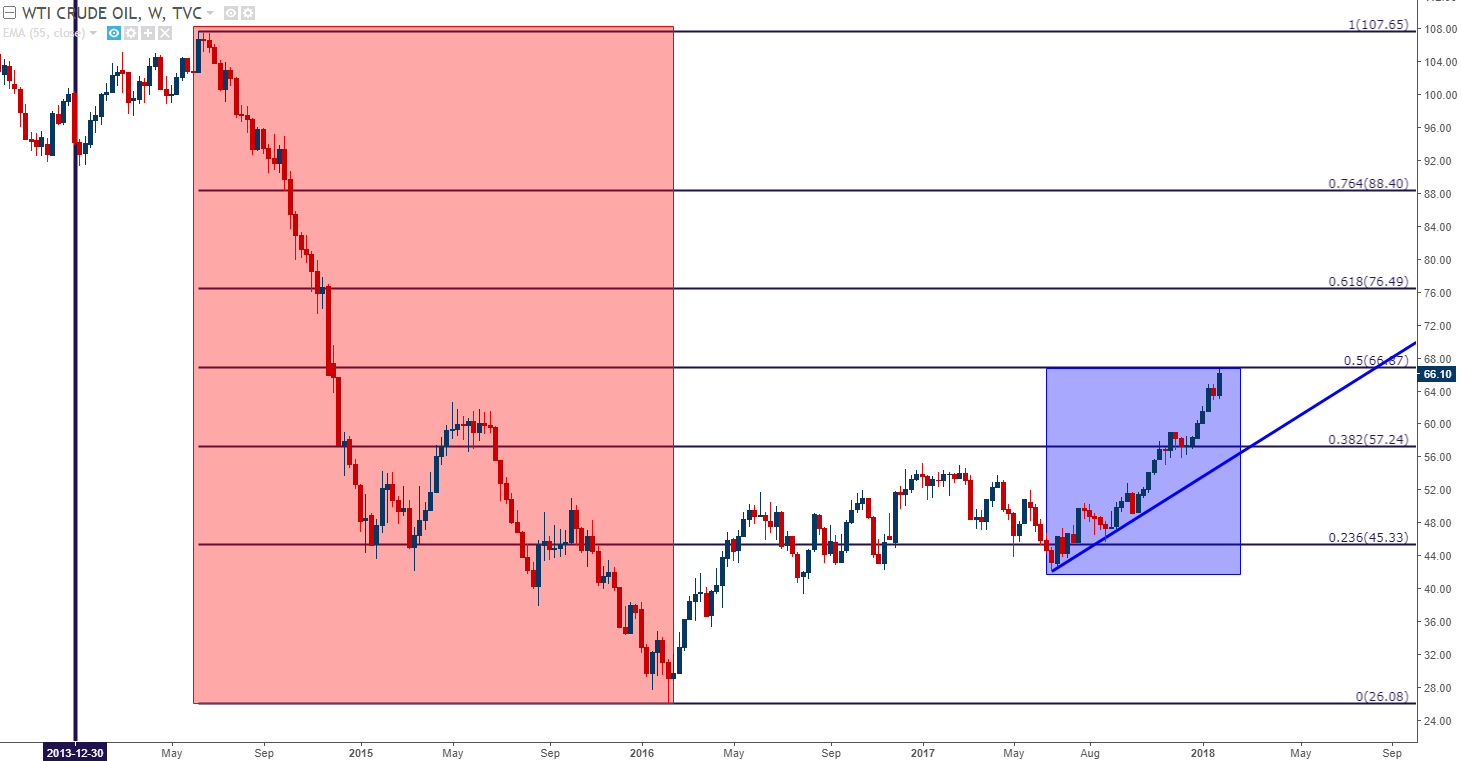
Chart prepared by James Stanley
The key driver of this move has been supply constraint, as mandated by the OPEC/Non-OPEC agreement that was extended in May of last year and initially announced in November of the year prior. And while that initial announcement seemed to do little to excite bulls, the extension last year came-in right around the time that the U.S. Dollar started to move in a near-vertical fashion (lower), and this has added a considerable amount of assistance in driving those topside trends in Oil prices. As the U.S. Dollar has continued to weaken, Oil prices have moved-higher and this has helped to push inflationary forces in many economies that aren’t used to seeing that, namely out of Europe and Japan.
The big driver in Oil prices this week appeared to emanate from a continued draw on US supplies. On Wednesday, supply data was released showing that crude inventories in the United States dropped for the tenth consecutive week, hitting the lowest levels since February of 2015. This was combined with another draft of weakness for the U.S. Dollar, helping to further propel Oil prices.
It’s long been thought or perhaps even known that higher Oil prices hasten the development and production of U.S. shale. US Oil production is expected to hit 10 million barrels per day in February, which would rival that of Saudi Arabia and is eclipsed only by Russia, who averaged 10.98 million bpd in 2017. This could certainly provide headwinds at some point down-the-road, not too dissimilar from what we saw in early 2016 when WTI moved down to a 12-year low around $26.08. But, at this point, any additional supply from shale simply has been unable to upset to the supply/demand equilibrium that’s helped to produce this bullish trend over the past seven months.
From a context perspective, retail traders remain net short of US Oil, per IG Client Sentiment at a clip of 1.21 to 1. This is a diminished short position from last week, and this can be indicating a heightened possibility of a pullback in the longer-term trend while that bigger picture bullish theme remains intact. If we combine this with the potential for resistance to set-in around that 50% Fibonacci retracement looked at above, and this can be an opportune time for bulls to take a back seat until a more confirmed element of support may show-up. The fundamental forecast for Oil will be set to neutral for the week ahead.
IG Client Sentiment – US Crude Oil
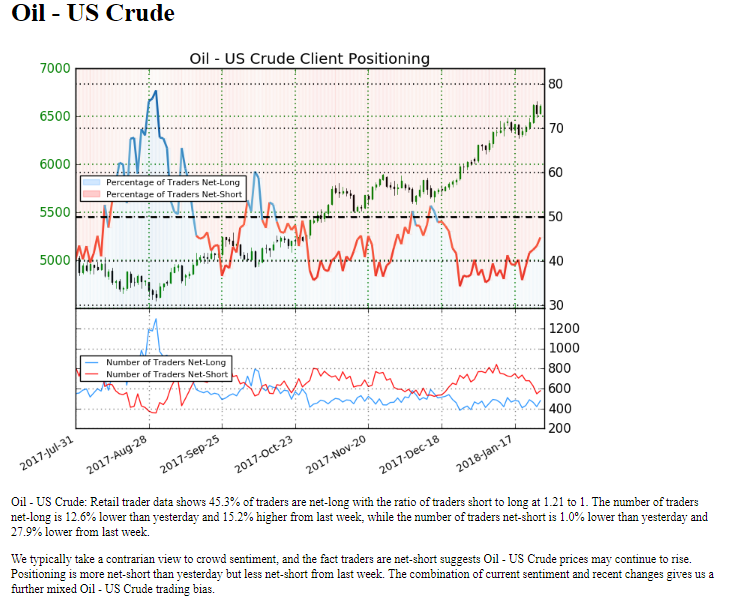
Data derived from IG Client Sentiment, prepared by James Stanley
--- Written by James Stanley, Strategist for DailyFX.com
To receive James Stanley’s analysis directly via email, please SIGN UP HERE
Contact and follow James on Twitter: @JStanleyFX


