


Talking Points:
- Crude oil, gold prices drop as President Trump boosts the US Dollar
- UK, US GDP data may upend commodities’ rebound in risk-on trade
- See our guide to learn what are the long-term forces driving crude oil
Commodity pricesretreated yesterday – with crude oil and gold dropping in tandem – as the US Dollar staged a sudden recovery following supportive comments from President Donald Trump. He said that he favored an “ultimately” stronger greenback, contradicting remarks from Treasury Secretary Steven Mnuchin made just a day earlier that seemed to celebrate recent depreciation as supportive for exporters.
The pendulum seems to be swinging the other way as Friday trade gets underway. Gold and crude oil prices are recovering while the US Dollar is back on the defensive as swelling risk appetite revives speculation that rosy global growth dynamics will see top central banks converging on the comparatively hawkish Fed, chipping away at the benchmark currency’s yield advantage and making alternatives look attractive.
Futures tracking the FTSE 100 and S&P 500 equity benchmarks are pointing convincingly higher before London and New York come online, hinting commodities will continue to recover in risk-on trade. The chipper mood may be upset by fourth-quarter UK and US GDP figures however. Slowdowns are expected on both fronts and any downside surprises beyond what is projected may sour sentiment.
Find out here what retail traders’ gold trade decisions hint about the price trend!!
GOLD TECHNICAL ANALYSIS – Gold prices paused to digest gains ahead of resistance at 1365.68, the 38.2%Fibonacci expansion, snapping a five-day winning streak. Still, the dominant near-term uptrend remains intact. A daily close above1365.68targets the 50% level at 1378.43. Alternatively, a turn back below the 1344.74-49.90 area (January 15 high, 23.6% Fib) exposes resistance-turned-support at 1325.96, the January 4 high).
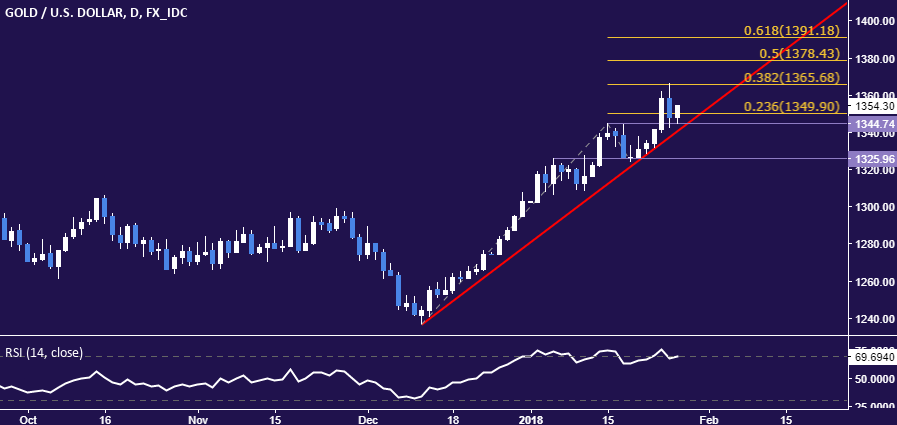
Chart created using TradingView
CRUDE OIL TECHNICAL ANALYSIS – Crude oil prices pulled back after testingthe 38.2% Fibonacci expansion at 66.21. Negative RSI divergence warns of ebbing upside momentum and hints a top may be in the works. Confirmation is absent however, with the near-term trend still defined by a series of higher highs and lows. A push below the 23.6% levelat 64.93 opens the door for a retest of 64.15 (14.6% Fib, trend line). Alternatively, a daily close above 66.21 exposes the 50% expansion at 67.24.
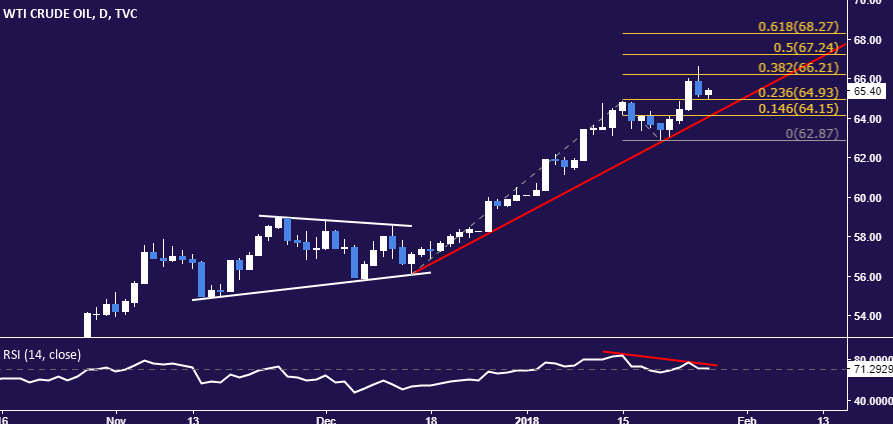
Chart created using TradingView
--- Written by Ilya Spivak, Currency Strategist for DailyFX.com
To receive Ilya's analysis directly via email, please SIGN UP HERE
Contact and follow Ilya on Twitter: @IlyaSpivak


