


Talking Points:
- Dollar's three-year low and critical breakdown not yet on equally-weighted Index chart
- EUR/USD has overtaken 1.2100 and 1.2200 and has seemingly turned its year's long trend, but the Dollar and Euro indexes play down conviction
- Pound index showed response to the recent Brexit speculation, but absent is a technical acheivement akin to GBP/USD's 1.3600 break
What are the DailyFX Analysts’ favorite trades for 2018? What are their fundamental and technical forecasts for the FX majors, indices and commodities through the first quarter? Download the guides on the DailyFX Trading Guides page.
There have been some extraordinary technical developments for some of the FX market’s most prominent crosses, and sometimes these moves are coming in contradiction to fundamentals. For some, the answer to reconciling this disparity is to simply drop one form of analysis completely. I think that is hasty and unproductive. The picture that we are drawing of individual currencies is often drawn from particular pairings. Yet, one FX pair represents two contributions the strength of the base currency (the first in the pair) and the strength of the quote currency (the second).
To what degree does a sharp move from say EUR/USD represent strength for the Euro or weakness from the Dollar? This pair has soared through collective resistance around 1.2100 and 1.2200 which is the midpoint of both the 2014-2017 range as well as the historical range from when the Euro began trading in earnest in 1999. An anecdotal evaluation of headlines shows that there is far more attribution to be made to the ‘Greenback’s decline’ than the ‘Euro’s advance’, and the fundamental justification is thereby dispensed in equal proportion. But what if we are getting the assessment backwards? What if the performance of a currency against a single counterpart is an aberration while it maintains healthy strength against all other counterparts?
Below, I give you the equally-weighted index of the 7 most common currencies utilizing the most liquid ‘majors’. It can be argued whether some trade weighting (as with the ICE’s DXY Dollar Index) or some other skew is appropriate to reflect the ‘true’ value. We can’t answer that here as there is no specific answer. However, we should reflect on the fluidity of valuation when we are making black-and-white evaluations for our trades. With a more dynamic assessment, we will tend to make better trading decisions.
The Dollar – DXY Trade-Weighted Index vs Equally-Weighted Synthetic
Looking at the first currency, we can see that the general structure of the weekly charts between the trade-weighted (meaning the EUR/USD is heavily represented to the tune of 2/3rds the index), we can see that the structure is similar. However, the differences in this case hold serious technical consideration. On the DXY, we have a remarkable head-and-shoulders neckline break while crossing the mid-point of a decade long range. On the equally-weighted index, we haven’t even hit a three-year low much less take out even the 38.2 percent Fib retracement of the 2011 to 2016 range (the lows and highs are event similar).
Trade-Weighted DXY (Weekly)
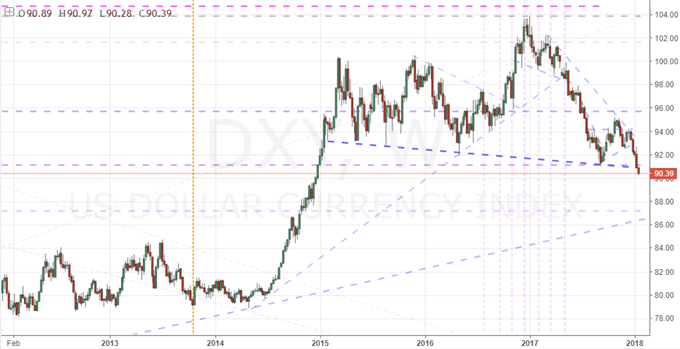
Chart created by John Kicklighter using TradingView Charts
Equally-Weighted Dollar Index (Weekly)
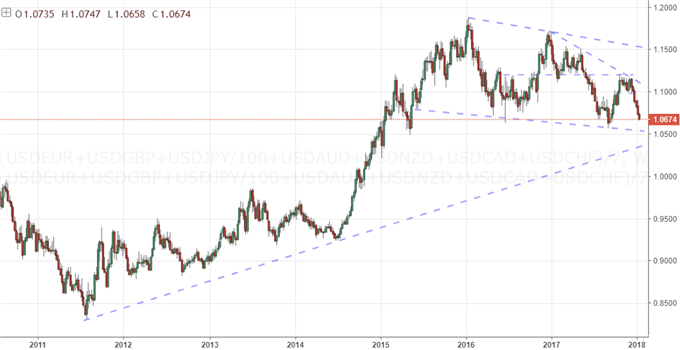
Chart created by John Kicklighter using TradingView Charts
Which one would you deem ‘right’? The answer to that question could encourage you to view the start of a waterfall tumble for the benchmark currency or keep you cautiously observing individual Dollar-based pairs like EUR/USD and GBP/USD where key breaks have been made and momentum is now the critical evaluation to be made.
The Euro Index – Not as Convincing as EUR/USD
Looking at the below, equally-weighted Euro index; one would have to seriously evaluate their convictions in EUR/USD. Where the cross broked critical resistance around 1.2150, this index has not cleared its own three-year high. Moreover, it didn’t tople nearly as fall as the pairing did from the 2014 peak. This looks a lot less ‘loaded’ than the favored. Yet, if neither Dollar nor Euro index have positioned to self-sustaining momentum, what does that mean for their marriage?
Equally-Weighted Euro Index (Weekly)
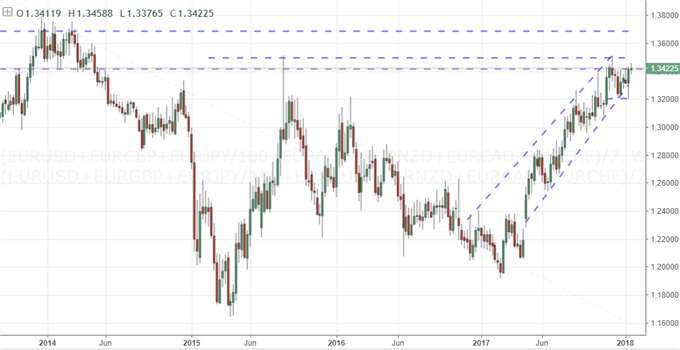
Chart created by John Kicklighter using TradingView Charts
The Pound Index – Lacking Cable’s Definitiveness
When we look to the Cable this past week, we find one of the most impressive moves across the liquid FX market. Having cleared 1.3600, the GBP/USD trades at its highest level since the post-Brexit crash and there is healthy pace to suggest innate follow through. Referencing BoE intention and favorable Brexit outlooks is natural in the wake of this. But what does the index say? The initial charge on Brexit news suggesting a soft Brexit was being sought by some EU members was registered, but no strong follow through is measured. Nor is there the critical technical clearance. Look to the EUR/GBP or GBP/JPY, do they offer the same enthusiasm?
Equally-Weighted Pound Index (Daily)
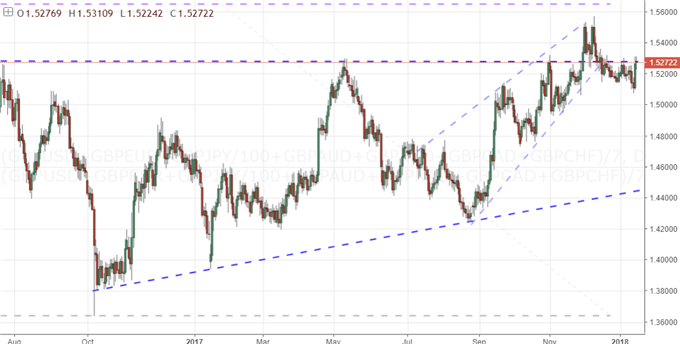
Chart created by John Kicklighter using TradingView Charts
The Yen Index – Progress In Congestion Beyond USD/JPY
If you trade USD/JPY, you know that the pair has dove from short-term resistance around 113.25 over the past few weeks and covered nearly 300 pips in the process. Looking out into the Yen crosses yields far less motivated intent. We can see below a distinct wedge consolidation formation like most individual pairs, but this one is pitched out of favor of the Yen (this is an index where the Yen is the second currency in all the component pairs) and it is tighter than the majority. That said, a break here could do well to signal greater conviction for what will be staggered key technical moves amongst many popular pairings.
Equally-Weighted Yen Index (Daily)
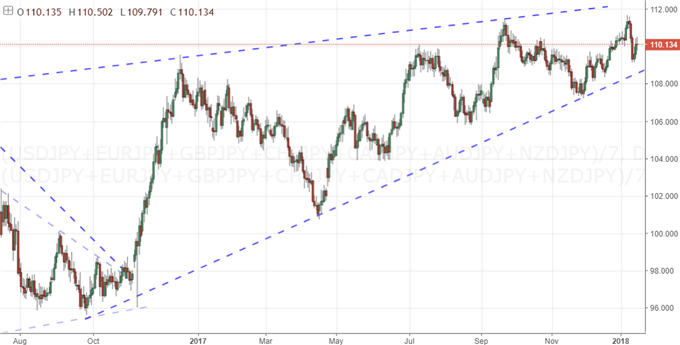
Chart created by John Kicklighter using TradingView Charts
Canadian Dollar – What Does NAFTA and the BoC Influence Really Look Like
The USD/CAD cross is the most liquid Loonie pairing, but there is frequent – and often times wide – deviation between what that pair does and the bearings from the likes of AUD/CAD, EUR/CAD and others. The NAFTA discussions going on clearly carry severe implications for USD/CAD as they are each other’s largest trade partner. The BoC is also due to hike rates this week, what does that look like without the dampening effect of a US Dollar comparison? See below.
Equally-Weighted Canadian Dollar Index (Daily)
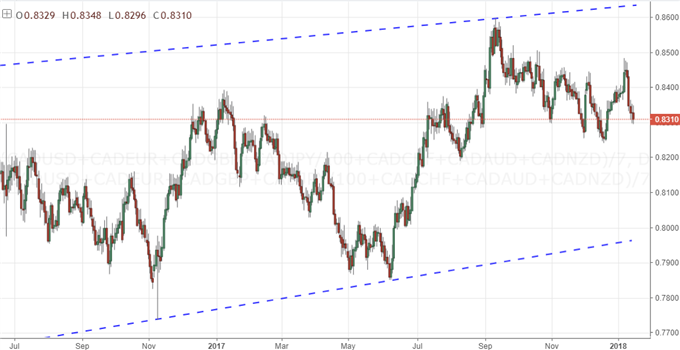
Chart created by John Kicklighter using TradingView Charts
The Australian Dollar Index – Range Without the Urgency
From AUD/USD, we have lacked a clear direction for some time. However, there is a notable progress in higher highs and higher lows stretching back to the early 2016 low. It looks like the pair is biding its time before the bullish pressure has built so high that it takes us on a sweeping recovery rally back towards the highs north of 1.0000 some five years ago. The Aussie Index curbs that speculative intent somewhat. There is an equal wedge instead of the ascending channel of its traded counterparts. A bullish break may be the result regardless whereby many crosses will find significantly undervalued opportunities, but there will be far less impetus than what is implied in AUD/USD alone.
Equally-Weighted Australian Dollar Index (Daily)
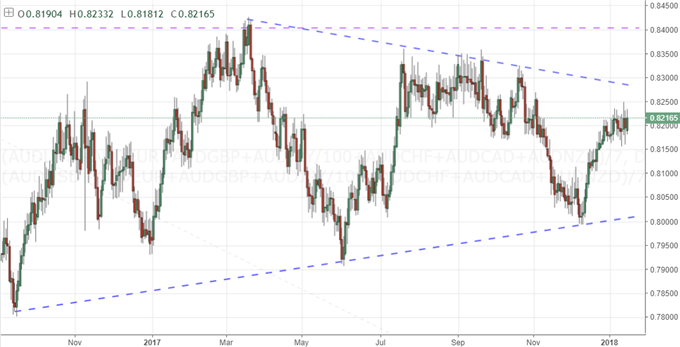
Chart created by John Kicklighter using TradingView Charts
The New Zealand Dollar Index – RBNZ Speculation Not So Intense
Fundamentally, I am of the view that there is significant discount for the New Zealand Dollar in terms of pricing the potential of an RBNZ rate hike in the foreseeable future. As one of the most permanent carry currencies in function, the Kiwi does not always benefit the moniker. The problem is that all rates are low. When looking to NZD/USD, the reversal from 0.6800 proceeded cleanly with an inverse head and shoulders reversal that has been a remarkably consistent trend since. There is still a ways to go before we take out the past three-years’ high around 0.7550, but it is tracking course. From the Kiwi index however, there is still much further to go relatively before we will be in a position to crack critical – and the assumption would be self-sustaining momentum – resistance.
Equally-Weighted New Zealand Dollar Index (Daily)
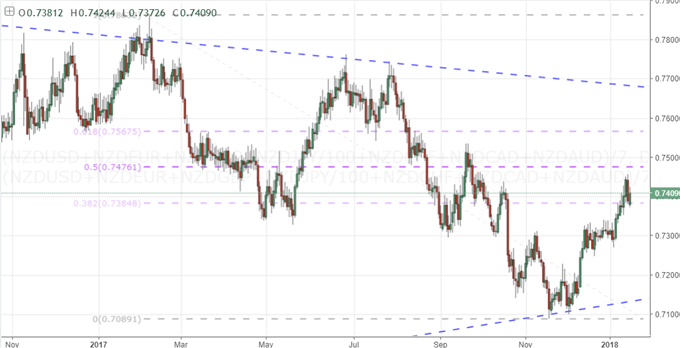
Chart created by John Kicklighter using TradingView Charts
To receive John’s analysis directly via email, please SIGN UP HERE


