S&P 500 OUTLOOK:
- The S&P 500 fails to rebound and posts a small loss amid cautious sentiment on Wall Street following the FOMC hawkish minutes
- All eyes will be on the U.S. employment report (NFP) on Friday
- Strong labor market data may trigger a temporary pullback in risk assets as it may reinforce the narrative the economy is well-positioned to withstand aggressive policy normalization
Trade Smarter - Sign up for the DailyFX Newsletter
Receive timely and compelling market commentary from the DailyFX team
Most read: Dow Jones, S&P 500, Nasdaq 100 Forecast - Pullback Testing Resolve
U.S. stocks failed to recover and finished marginally lower on Thursday amid cautious sentiment among investors following the large sell-off on the previous day. At the market close, the S&P 500 fell 0.10% to 4,696, after fluctuating between small gains and losses for most of the session. The Nasdaq 100 also posted a modest decline, retreating 0.04% to 15,765 amid higher Treasury yields. Elsewhere, the economically sensitive Dow Jones underperformed the major averages, dropping 0.47% to 36,236, dragged down by weaker than expected Services ISM, which printed at 62, well below the median forecast of 67.5.
During the trading session, the mood on Wall Street remained somewhat jittery after the December FOMC minutes, released Wednesday afternoon, flagged the chance of earlier interest rates hikes and signaled it may be appropriate to begin trimming bond holdings soon post-liftoff. The aggressive tightening cycle being considered by the Federal Reserve is a recipe for volatility and may become a significant headwind for stocks, particularly those with stretched valuations in the growth space.
Looking ahead, all eyes will be on the December nonfarm payrolls data due Friday morning. Consensus expectations suggest that the US economy created 400,000 new jobs, but the results could surprise to the upside after the ADP report showed that the private sector hired at a breakneck pace, adding 807,000 workers last month. A solid NFP print, while fundamentally a good outcome for the economy, could trigger a transitory bearish reaction in risk assets as it would endorse the Fed’s argument that the labor market is recovering energetically and is sufficiently strong to withstand multiple rate hikes and quantitative tightening (via balance sheet runoff).


BALANCE SHEET RUNOFF
With the passage of time, bonds in the Fed’s portfolio will inevitably become due at different intervals. At maturity, the central bank will reinvest repayments of principal to keep its holdings constant while on easing mode. However, once balance sheet normalization begins, the bank will cease to reinvest some or all maturing securities to reduce its assets, a process known as quantitative tightening. Quantitative tightening, which is being entertained by Fed officials, drains liquidity from the system and can, therefore, become a negative catalyst for equities, especially if investors begin to price a “policy error” caused by a premature pullback of accommodation. In any case, to better understand what policymakers will do in terms of monetary policy, traders should closely follow Fedspeak in coming days and macro data. Much insight can be gained from central bank language and economic reports.


S&P 500 TECHNICAL ANALYSIS
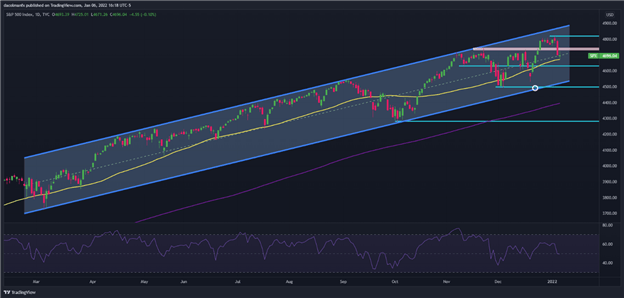
After breaking below the 4,735 floor, the S&P 500 accelerated its retreat, but was repelled by the 50-day moving average. Despite this rejection, the technical signals remain slightly bearish in the very short term, but if the index manages to reclaim the 4,735 area, now resistance based on the polarity principle, we could see a test of the all-time high near 4,818 within days. On the flip side, if sellers resurface and push the price below the 50-day SMA, the 4,630 zone will become the immediate downside focus.
S&P 500 TECHNICAL CHART

S&P 500 (SPX) Chart by TradingView
EDUCATION TOOLS FOR TRADERS
- Are you just getting started? Download the beginners’ guide for FX traders
- Would you like to know more about your trading personality? Take the DailyFX quiz and find out
- IG's client positioning data provides valuable information on market sentiment. Get your free guide on how to use this powerful trading indicator here.
---Written by Diego Colman, Contributor


