


U.S. Indices Technical Highlights:
- S&P 500 surges off support, new record high near
- Dow Jones finds significant support around the 200-day
- Nasdaq 100 top of channel test nearing again

Dow Jones, S&P 500, Nasdaq 100 Forecast: Pullback Testing Resolve
The S&P 500 is showing us why chasing stocks to new record highs can be painful. The breakout is already failing, but not unexpected even if the trend ultimately remains firmly higher. The long-term pattern for stocks is to break out to new highs and then within days to weeks retrace a large portion, if not all, of the gains made in fresh record territory. This is why on this end a buy-the-dip approach is preferred.
With that said, we are now below the prior record high and on the way towards what could become a very important trend test. The October trend-line lies below, and has been validated twice during the month of December.
Hold this line again and the broader trend remains firmly intact and new highs could come in fairly short order. On the flip-side, if this line breaks, then look for a broader correction or worse to set in. For now, in the very short-term there does appear to be some room to the downside to at least the October trend-line.
S&P 500 Daily Chart

The Dow Jones is also back below its prior record high set in November at 35565. The index is set up to decline some more, but support isn’t as clear as it is with the S&P. The most recent low came off the 200-day moving average, but to reach that point again will require a fairly sharp decline. If the SPX can hit and hold the October trend-line while the DJI demonstrates relative strength, it could set it up as a preferred long candidate later on.
Dow Jones Daily Chart
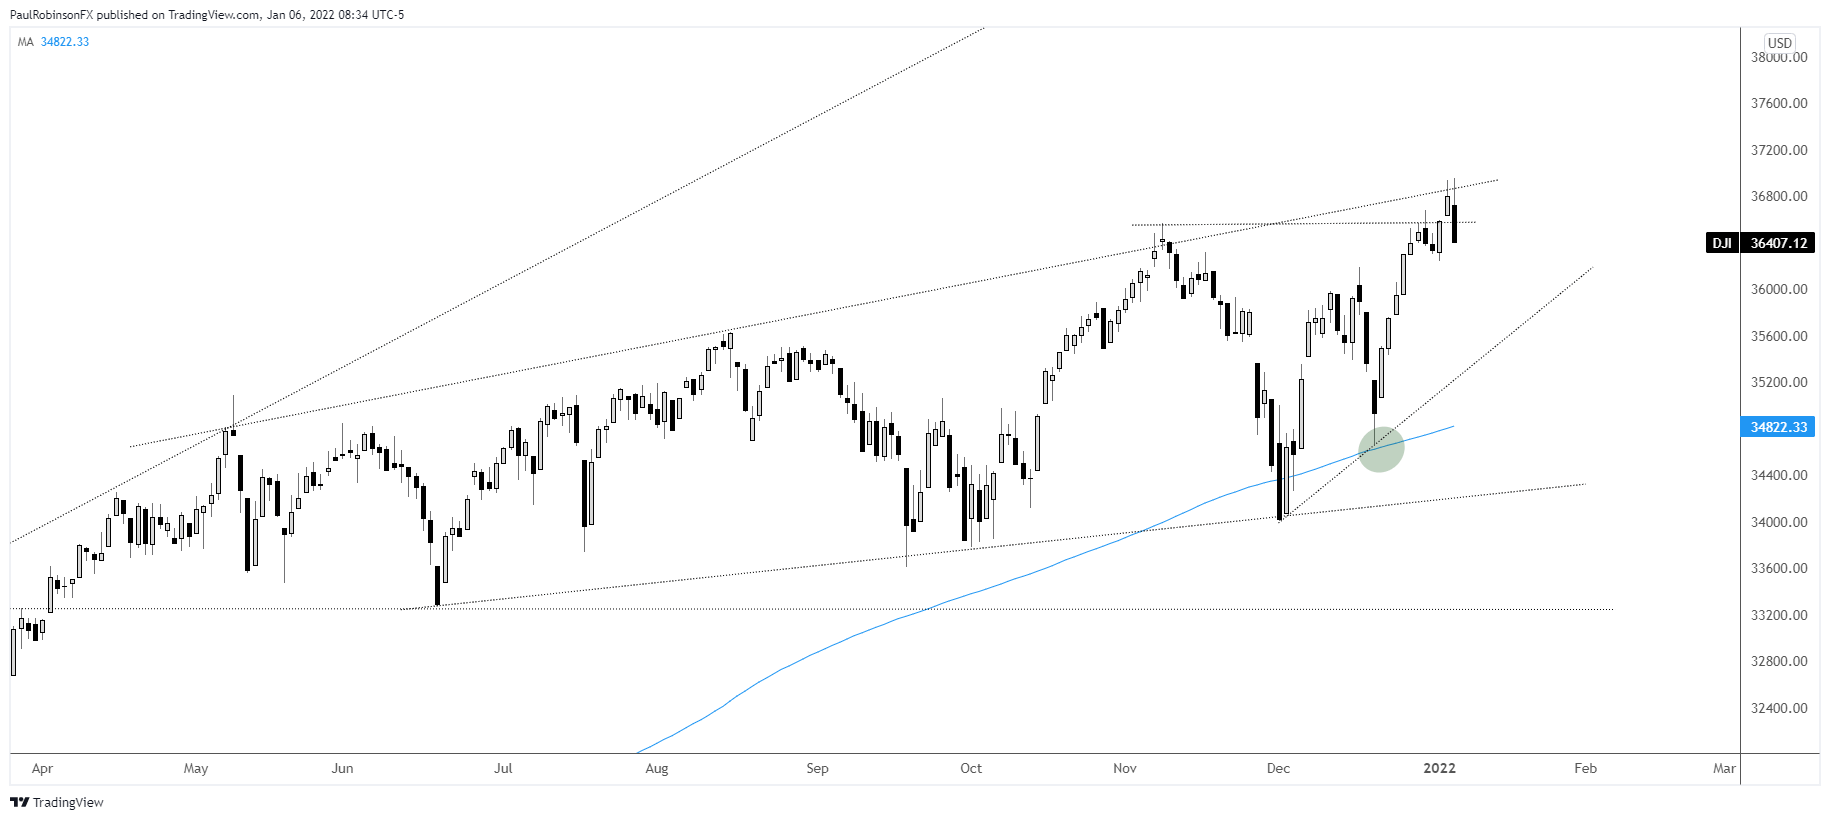
Dow Jones Chart by TradingView
The Nasdaq 100 is quickly rolling over towards the lower end of a bull market channel dating back to the back half of 2020. A test of the channel is considering a major development as it has helped keep the NDX pointed higher for quite some time. A hold and turn off the lower side will keep longs well intact, while a break may indicate a major shift in trend coming.
Nasdaq 100 Daily Chart

Nasdaq 100 Chart by TradingView
Resources for Forex Traders
Whether you are a new or experienced trader, we have several resources available to help you; indicator for tracking trader sentiment, quarterly trading forecasts, analytical and educational webinars held daily, trading guides to help you improve trading performance, and one specifically for those who are new to forex.
---Written by Paul Robinson, Market Analyst
You can follow Paul on Twitter at @PaulRobinsonFX


