


Gold Price Talking Points:
- Gold prices started the year with an aggressive breakout to fresh six-year-highs.
- As fear has been priced-out of markets, Gold prices have settled, although the longer-term backdrop retains a bullish bias driven by longer-term expectations around global Central Banks.

Gold Prices Peel Back to Swing Support, Bounce up to 2019 High
Gold prices started the year with an aggressive show of strength, quickly running up to a fresh six-year-high as tensions firmed between the US and Iran. This furthered a move that showed visibly in late-December, as Gold prices had put in a topside breakout from a bull pennant formation; but this addition of fear put the theme in fever pitch as buyers rushed to the bid.
At this point, Gold has set another fresh six-year-high at 1611; but has since seen that move pull back as tensions of eased around the US-Iran scenario. This doesn’t necessarily eliminate the longer-term bullish backdrop, as another factor of importance remains of interest, and that’s the potential for more softening from global Central Banks. But, this is likely a theme that will remain behind the front page, at least for now, leading to additional pullback potential in Gold prices as that fear bid gets further priced-out of the equation.
The support looked at in last week’s article around 1535 has come in to help hold the lows. That support inflection led to a topside bounce and prices ran for more than $20 until resistance could show around 1557, which is the 2019 swing high. That level capped the highs for today and sellers appear to be on their way back into short-term Gold price action.
Gold Hourly Price Chart

Chart prepared by James Stanley; Gold on Tradingview
Current price action is finding support around the 38.2% retracement of the November-January move and this level has already exhibited a bit of support earlier this week. This price may not hold for long, and a breach below opens the door for a re-test of the 1535 level, which was a swing-high from last September that current defines the weekly low. Below that, 1528 becomes of interest as this is the 50% marker of the November-January move; and below that is a confluent zone of interest that runs from 1515-1520. The former of those prices saw numerous resistance inflections in October-leading-into-November and provided a brief pause when Gold prices were breaking-out again ahead of year-end. But, to date, this price hasn’t yet shown much for support and if price action does volley all the way down there, this could become interesting for bullish plays again.
| Change in | Longs | Shorts | OI |
| Daily | 1% | -3% | -1% |
| Weekly | 2% | -8% | -2% |
Gold Eight-Hour Price Chart

Chart prepared by James Stanley; Gold on Tradingview
Gold Price Strategy Moving Forward
As looked at in this week’s technical forecast, the longer-term backdrop for Gold remains bullish in nature. This may be a bit obscured, however, by that early-year show of fear that created an outsized breakout. I had discussed the bigger-picture backdrop in Gold as one of the ‘top trade ideas’ for this year, and that was largely driven by the premise of global Central Banks remaining loose-and-passive to stoke global growth. That hasn’t really had much effect of recent, however, as the breakout was very much driven by fear.
For longer-term approaches, that confluent zone that runs from 1515-1520 could remain attractive for support plays.
Gold Price Daily Chart
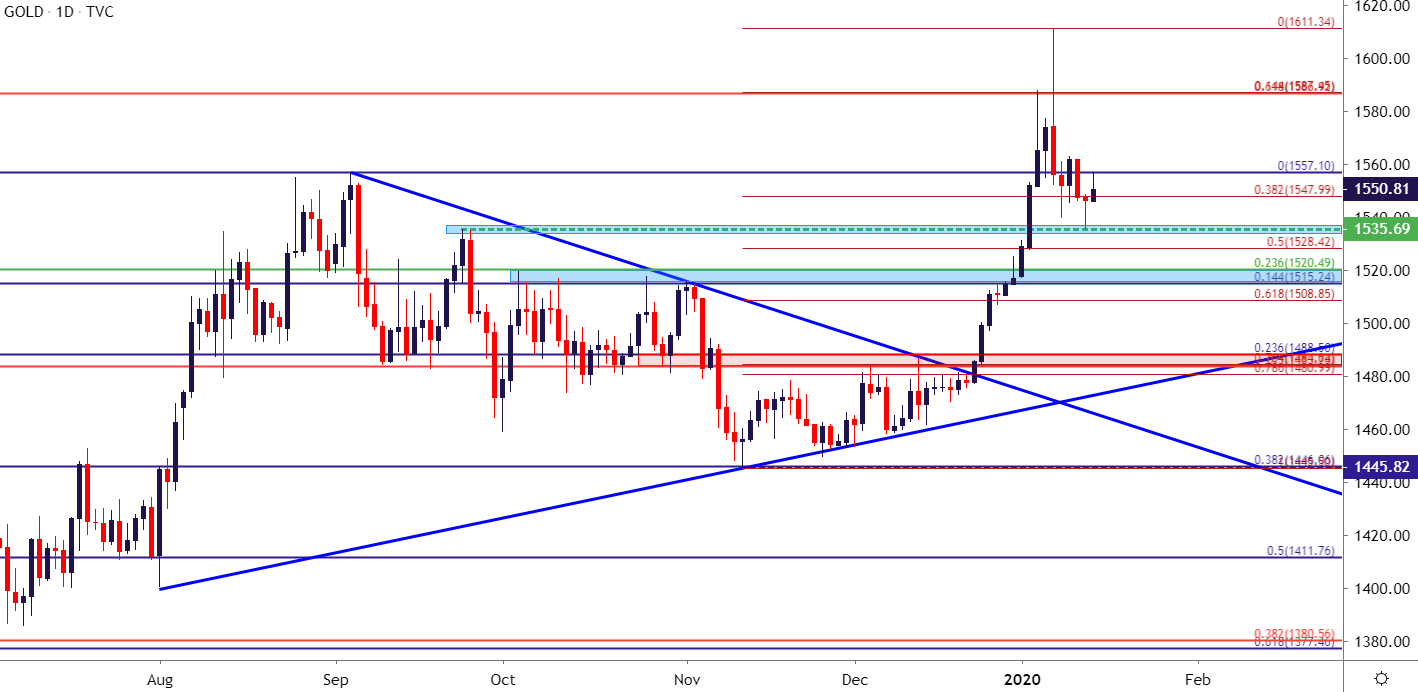
Chart prepared by James Stanley; Gold on Tradingview
--- Written by James Stanley, Strategist for DailyFX.com
Contact and follow James on Twitter: @JStanleyFX


