


Gold Price Talking Points:
- It’s expected to be a big week for Gold prices with a busy economic calendar. The FOMC walks into a highly-expected rate cut this Wednesday, the first since the Financial Collapse more than ten years ago. The Bank of England hosts a Super Thursday even the morning after, and the week closes with the release of Non-Farm Payroll numbers out of the US.
- The big question around Gold is whether this week will give bulls the motivation they need to punch up to fresh six-year-highs or whether this theme will remain under-the-surface until later in the year. The manner in which the FOMC presents the Wednesday rate cut will likely have a large bearing on which of these takes place.
- DailyFX Forecasts are published on a variety of markets such as Gold, the US Dollar or the Euro and are available from the DailyFX Trading Guides page. If you’re looking to improve your trading approach, check out Traits of Successful Traders. And if you’re looking for an introductory primer to the Forex market, check out our New to FX Guide.
Gold Prices Grasp for Support Ahead of the Fed’s First Rate Cut in a Decade
This should be a big week for Gold prices, one way or the other. This Wednesday’s FOMC rate decision looms large as a number of risk trends are waiting to see just how dovish the Federal Reserve might be. A 25 basis point cut has long been expected at this meeting, and this would mark the bank’s first move towards looser policy since the Financial Collapse more than ten years ago. But the backdrop with which this move takes place has a few items of abnormality: This will be the first rate move since Jerome Powell made every meeting live coming into this year. Markets have also diverged rather far from the Fed’s most recent dot plot matrix concerning rate moves in the rest of the year. The Fed has so far said that they expect one cut while markets are pricing in three or more going out to December.
This is key for Gold prices as a more-dovish stance at the Fed can open the door for fresh six-year-highs in the yellow metal. The big question is whether the Fed will highlight future softening in the rest of this year or frame Wednesday’s rate move as a ‘one and done’ after overtightening last year. Should the latter take place, pressure can remain on the bid of the US Dollar and this could keep Gold prices on their back foot until the bank flips to a move-dovish stance later in the year.
As an illustration of this theme, the scenario from a couple of weeks ago remains key: After an off-hand comment from NY Fed President John Williams was widely-inferred to mean that the Fed was looking at a 50 basis point cut, Gold prices flew up to fresh six-year-highs as the US Dollar dropped aggressively. But – when that comment was walked-back, Gold prices pulled back to support and have largely remained around this area ever since. The same 1415 area, taken from the 14.4% Fibonacci retracement of the June breakout, has come back in to help hold the lows similar to what happened two weeks ago.
Gold Four-Hour Price Chart

Chart prepared by James Stanley
Taking a step back on the Gold chart and the current area of resistance is imposing. This area, drawn from the August 2013 swing-high down to the 50% marker of the 2012-2015 major move came into play more than a month ago. Since then – it’s held as resistance in each week since, including a lower-high from last week after prices had softened when the NY Fed walked back Williams’ comments.
Gold Price Weekly Chart

Chart prepared by James Stanley
Gold Price Strategy
At this point, the bullish side of Gold prices looks to be fairly-aligned with just how dovish the Fed might be on Wednesday. If the bank forecasts future softening or keeps the door open for even lower rates later in the year, the bid in Gold will likely see some action. If the bank does mention the possibility of QE, then Gold prices can really fly-higher and this is when projections above 1500 come back into play. Otherwise, if the Fed does pitch this rate cut as a ‘one and done’ type of deal in order to moderate rates after last year’s overtightening, then Gold prices may scale back to a deeper support area on the chart. This can keep focus on areas such as 1375, which was the 2016 swing-high that has yet to be tested for support since the June breakout. A bit-deeper, another area of interest exists around 1357.50, which was the 2017 swing-highs that later come into help cauterize 2018 resistance.
Gold Daily Price Chart
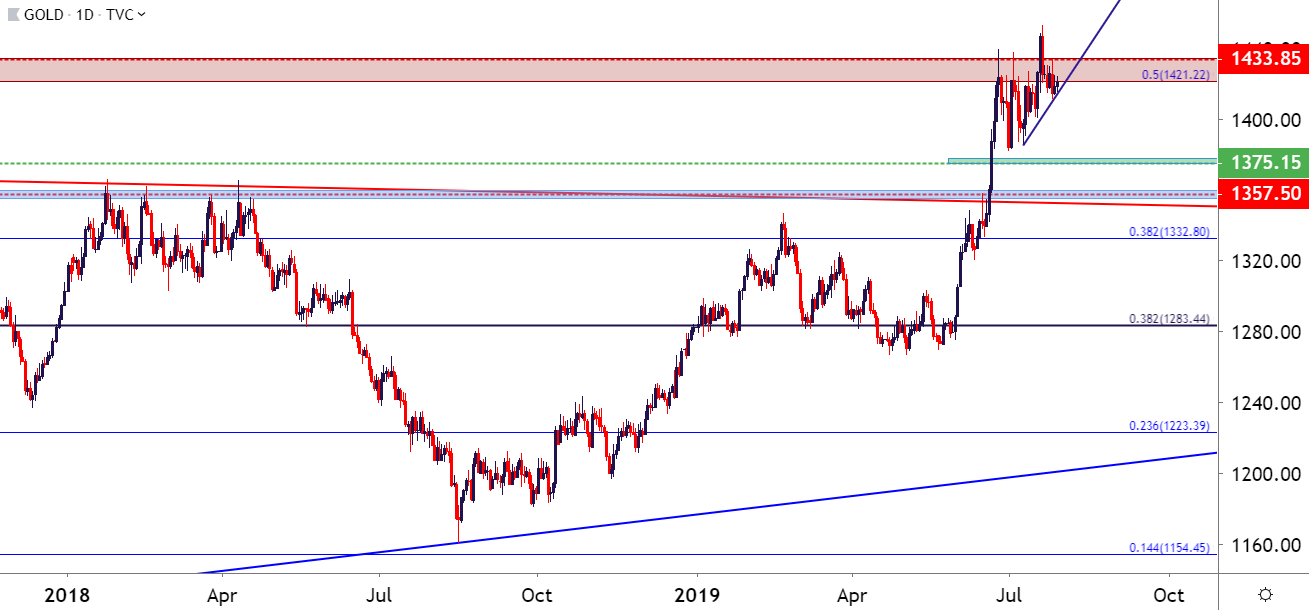
Chart prepared by James Stanley
To read more:
Are you looking for longer-term analysis on the U.S. Dollar? Our DailyFX Forecasts have a section for each major currency, and we also offer a plethora of resources on Gold or USD-pairs such as EUR/USD, GBP/USD, USD/JPY, AUD/USD. Traders can also stay up with near-term positioning via our IG Client Sentiment Indicator.
Forex Trading Resources
DailyFX offers an abundance of tools, indicators and resources to help traders. For those looking for trading ideas, our IG Client Sentiment shows the positioning of retail traders with actual live trades and positions. Our trading guides bring our DailyFX Quarterly Forecasts and our Top Trading Opportunities; and our real-time news feed has intra-day interactions from the DailyFX team. And if you’re looking for real-time analysis, our DailyFX Webinars offer numerous sessions each week in which you can see how and why we’re looking at what we’re looking at.
If you’re looking for educational information, our New to FX guide is there to help new(er) traders while our Traits of Successful Traders research is built to help sharpen the skill set by focusing on risk and trade management.
--- Written by James Stanley, Strategist for DailyFX.com
Contact and follow James on Twitter: @JStanleyFX


