


Gold Price Talking Points:
- Gold prices posed a short-term breakout from an ascending triangle formation this morning; but quickly returned back to trend-line support after the start of the ECB’s press conference.
- Next week brings a heavily-anticipated FOMC rate decision in which the bank is expected to pose their first rate cut in over ten years. But that is likely priced-in at this point, meaning the large focus will be on what the FOMC might have in store for the rest of 2019.
- DailyFX Forecasts are published on a variety of markets such as Gold, the US Dollar or the Euro and are available from the DailyFX Trading Guides page. If you’re looking to improve your trading approach, check out Traits of Successful Traders. And if you’re looking for an introductory primer to the Forex market, check out our New to FX Guide.
Gold Price Breaks Out, Pulls Back Around ECB
Gold prices caught a bid again this morning to test above the 1430 level. That price has now been tested thrice in the month of July but, to date, buyers haven’t been able to yet leave it behind. The source of this morning’s strength appears to be emanating from the European Central Bank rate decision where the bank made the initial steps towards softer policy while talking up the potential for future QE. This could provide further motive for continued topside in Gold as the world’s largest Central Bank looks at money printing potential down-the-road to stimulate the European economy.
The big question on Gold prices at the moment is one of timing: With a key FOMC rate decision on the calendar for next week, in which market participants are expecting a very dovish outlay, will Gold bulls be able to control the trend up to fresh highs? Or, is this another false breakout that will see prices moderate ahead of next week’s highly-expected FOMC rate decision?
From the shorter-term look, the door could remain open for further gains in Gold. As discussed on Monday, support has shown around the 1415 level in Gold which is the 14.4% Fibonacci retracement of the June breakout. Resistance was coming in around 1427, which was a swing-high that posted earlier in July. But after the Monday test of resistance, buyers continued to come-in at higher-lows, leading to the build of a short-term ascending triangle on the chart. That formation will often be approached with the aim of bullish breakouts, looking for the enthusiasm that’s brought bulls in at higher-lows to eventually take over for a topside breakout through resistance.
Gold Hourly Price Chart
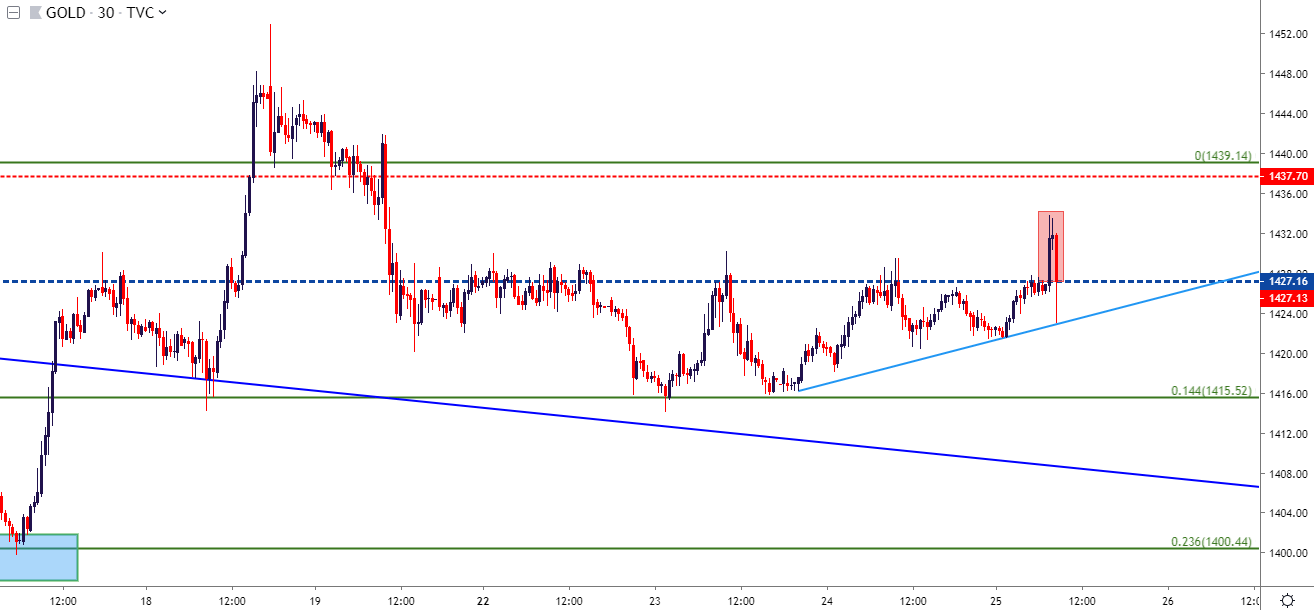
Chart prepared by James Stanley
Given that this current breakout has already begun and chasing here could be a perilous endeavor. The next spot of resistance on the chart shows around prior swing-highs at 1437.70-1439.14, and this could be looked to for target potential. For bullish trend strategies, a hold of support at prior resistance, taken from around that 1427 area, can re-open the door for topside exposure, targeting that potential resistance zone around 1437-1439. This would be an aggressive way of approaching the short-term move, particularly given the two-way volatility that’s shown around this morning’s ECB rate decision.
Gold 30-Minute Price Chart

Chart prepared by James Stanley
Taking a further step back, and there could be increased concern about holding large exposure at current levels. The brute-force breakout from June has thus far seen considerable digestion in the month of July. The first half of the month was marked by the build of a symmetrical wedge pattern, which when taken with the prior bullish trend produces a bull pennant formation. As discussed two weeks ago as that formation was building, this can offer an element of bias to an otherwise non-directional symmetrical wedge formation; looking for the prior trend to continue pushing prices higher after a round of digestion.
That breakout took hold with aggression last week on the heels of some comments from NY Fed President John Williams. Gold prices temporarily perched about the 1450 level as USD-weakness was all the rage; but as the NY Fed later walked those comments back, Gold prices moderated back to the same 1415 level of support that had set the prior swing-low, and thus far that support has held through this week. This denotes the bullish potential around this theme for the FOMC rate decision set to take place next Wednesday.
Gold Eight-Hour Price Chart

Chart prepared by James Stanley
Gold Prices Longer-Term
So, the for the near-term breakout, it appears too late to chase. Short-term price action is so far away from nearby supports that justifying topside entries right now could be a challenge. So what are Gold bulls lacking exposure to do?
There are a couple of different ways to handle this and the effectiveness of the approach will likely be determined by just how dovish the FOMC is next week, which is a difficult bet to handicap at the moment.
But – this does highlight potential. Should the Fed come out less dovish than markets are expecting, which likely will not be difficult to do given the huge divergence that remains between expectations from rates markets and the FOMC, and this could prelude a larger pullback from last month’s breakout before that bigger-picture, longer-term trend is ready to fly past the 1500 marker. For that approach, I’ve been focusing-in on prior resistance levels around 1375 and another around 1357.50. The former price was the 2016 swing high while the latter level was the 2017 high which helped to cauterize resistance in 2018. These key zones of prior resistance have yet to be tested for support; and a pullback around a less-dovish FOMC next week could fit nicely with setting up prior resistance as higher-low support in a burgeoning, longer-term up-trend.
Gold Price Daily Chart

Chart prepared by James Stanley
To read more:
Are you looking for longer-term analysis on the U.S. Dollar? Our DailyFX Forecasts have a section for each major currency, and we also offer a plethora of resources on Gold or USD-pairs such as EUR/USD, GBP/USD, USD/JPY, AUD/USD. Traders can also stay up with near-term positioning via our IG Client Sentiment Indicator.
Forex Trading Resources
DailyFX offers an abundance of tools, indicators and resources to help traders. For those looking for trading ideas, our IG Client Sentiment shows the positioning of retail traders with actual live trades and positions. Our trading guides bring our DailyFX Quarterly Forecasts and our Top Trading Opportunities; and our real-time news feed has intra-day interactions from the DailyFX team. And if you’re looking for real-time analysis, our DailyFX Webinars offer numerous sessions each week in which you can see how and why we’re looking at what we’re looking at.
If you’re looking for educational information, our New to FX guide is there to help new(er) traders while our Traits of Successful Traders research is built to help sharpen the skill set by focusing on risk and trade management.
--- Written by James Stanley, Strategist for DailyFX.com
Contact and follow James on Twitter: @JStanleyFX


