


Gold Price Talking Points:
- Gold prices pressed the highs earlier this morning, with buyers pulling back before the 1439 swing-high from last week could be tested.
- After gold’s almost 13% gain in the month of June, buyers continue to show some element of responsiveness at support. But do gold bulls have the ability to continue pushing gold prices to fresh six-year-highs?
Gold Prices Set Lower-High After Failed Breakout Attempt
Gold prices put in an impressive final month of Q2, and this furthered a longer-term theme after strength began to show in Gold prices in Q3 of last year. Gold prices climbed from August of last year into February of this year, with digestion of that move showing up in mid-February. That ran through most of the month of May until buyers came alive later in the month. This led to a strong topside incline throughout June as prices broke-out to fresh six-year-highs.
Gold Price Daily Chart

Chart prepared by James Stanley
Gold Prices Caught at Resistance Around Prior Six-Year-Highs
Taking a step back and this area of resistance has a bit of historical relevance with Gold prices. The level at 1433.85 is the August 2013 swing-high, and this level is coupled with the 50% retracement of the 2012-2015 pullback. This longer-term zone of resistance in Gold looked at last week has continued to restrain the topside advance.
Gold Weekly Price Chart
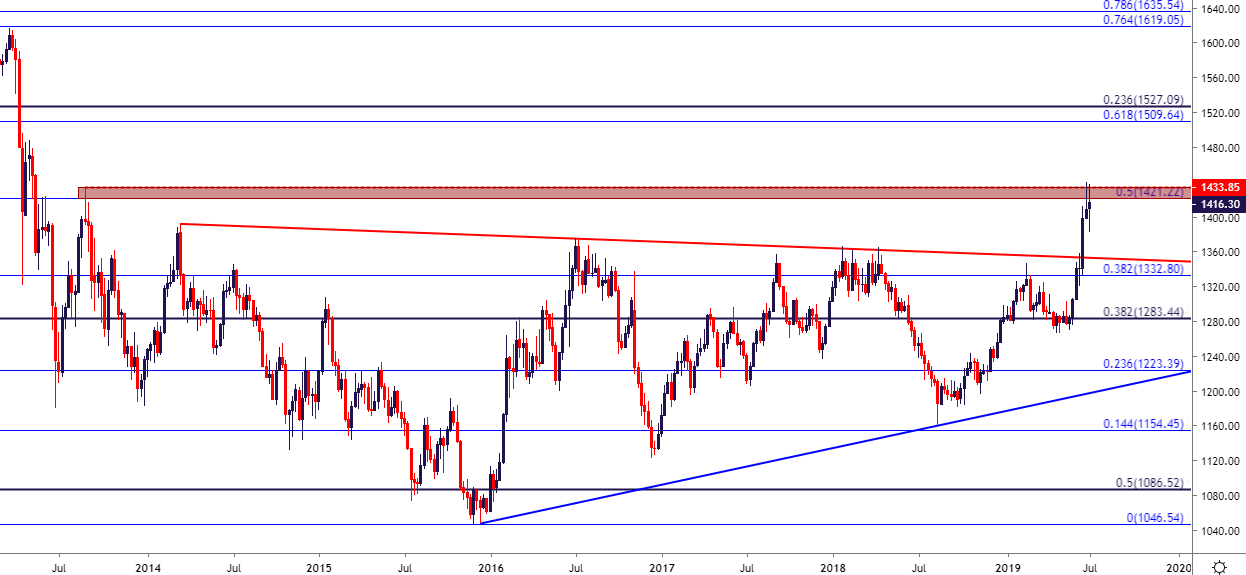
Chart prepared by James Stanley
Gold Trading Strategy Moving Forward
At this point, traders are likely going to want to continue to expect heightened volatility around this theme. Tomorrow is a holiday in the United States and the day after brings Non-Farm Payrolls. This will likely take place amidst a backdrop of lower liquidity, which can lead to sharp and unpredictable moves in either direction. Combine that with the fact that the US Dollar is sitting at an area of lower-high resistance following the June sell-off, and there are a number of possible scenarios to entertain.
For those looking at longer-term bullish strategies, continuing to focus on support potential could be an attractive way of following this theme. The same zone around 1375 that hast yet to come back into play could be incorporated as an ‘s1’ area for support potential, while the prior zone consisting of swing-highs from 2017 sits below that, running around the 1357.50 area on the chart. Each of those prices are confluent with Fibonacci levels from the recent topside breakout, with the 38.2% marker at 1376 while the 50% marker rests very near the 2017 swing-high, plotted at 1357.14.
Gold Four-Hour Price Chart
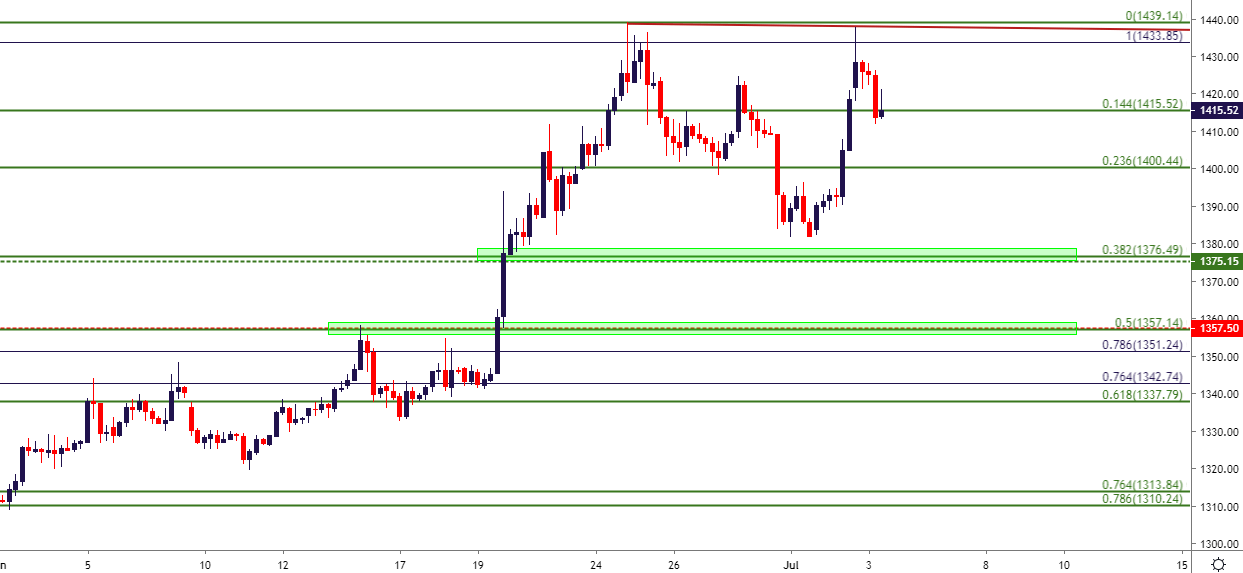
Chart prepared by James Stanley
Gold Price Reversal Strategies
This would be a bit more cut-and-dry given recent dynamics and the fact that buyers were unable to test that prior swing high. Key for this approach would be the trader’s confidence in a resurgence of US Dollar strength; and given the NFP event sitting on the docket for Friday, that possibility certainly does exist. For traders looking to work with reversal themes, stops above the six-year-highs can keep the door open for as such. This would be approximately $25 of risk given current price, so the trader would likely want to look for initial targets at 1390 or lower in order to justify a minimum one-to-one risk-reward ratio. Secondary target potential could be investigated around the ‘s1’ zone looked at above, with tertiary targets set around the ‘s2’ zone, taken from around the 2017 swing-highs in Gold.
Gold Price Two-Hour Chart

Chart prepared by James Stanley
To read more:
Are you looking for longer-term analysis on the U.S. Dollar? Our DailyFX Forecasts have a section for each major currency, and we also offer a plethora of resources on Gold or USD-pairs such as EUR/USD, GBP/USD, USD/JPY, AUD/USD. Traders can also stay up with near-term positioning via our IG Client Sentiment Indicator.
Forex Trading Resources
DailyFX offers an abundance of tools, indicators and resources to help traders. For those looking for trading ideas, our IG Client Sentiment shows the positioning of retail traders with actual live trades and positions. Our trading guides bring our DailyFX Quarterly Forecasts and our Top Trading Opportunities; and our real-time news feed has intra-day interactions from the DailyFX team. And if you’re looking for real-time analysis, our DailyFX Webinars offer numerous sessions each week in which you can see how and why we’re looking at what we’re looking at.
If you’re looking for educational information, our New to FX guide is there to help new(er) traders while our Traits of Successful Traders research is built to help sharpen the skill set by focusing on risk and trade management.
--- Written by James Stanley, Strategist for DailyFX.com
Contact and follow James on Twitter: @JStanleyFX


