


Gold Price Outlook Talking Points:
- Gold prices have capped a riveting month of June as the yellow metal gained as much as 12.9% from the May 30 low.
- Gold prices have started to scale back after finding resistance at prior six-year-highs, will bulls step-in to offer higher-low support to continue last month’s topside theme?
Gold Prices Continue to Retrace After Finding Resistance at Prior Six-Year-Highs
It was a strong month for gold as prices continued to ascend throughout June, with gains each week of the month into the end of Q2. Price action set a fresh six-year-high by breaking-out to the 1439 level; but buyers weren’t able to muster much strength thereafter, leading to a three, now four-day pullback in gold prices. Taking a step back, and the resistance zone produced from that prior six-year-high to the 50% marker of the 2012-2015 major move has thus far held the highs in the bullish breakout in gold.
Gold Price Weekly Chart
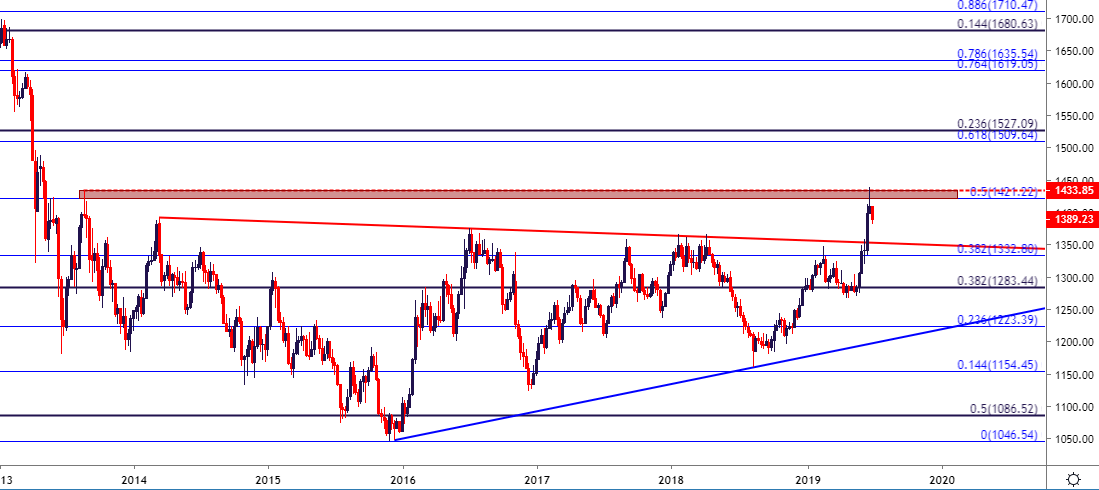
Chart prepared by James Stanley
The first support zone looked at in last Wednesday’s article has been unable to since hold the lows, and this came in around the 1400 level on the chart which is confluent with the 23.6% Fibonacci retracement of last month’s bullish move. Additional support potential exists a bit deeper, around 38.2 and 50% retracements from that same prior move, both of which sync with prior price inflections to create confluent areas of interest.
The area around 1357.50 is particularly interesting, as that price was the 2018 swing high; tested in both January and April before sellers were able to take-control. This is very close to the 50% marker of that recent major move, which comes in at 1357.14.
Gold Price Eight-Hour Chart
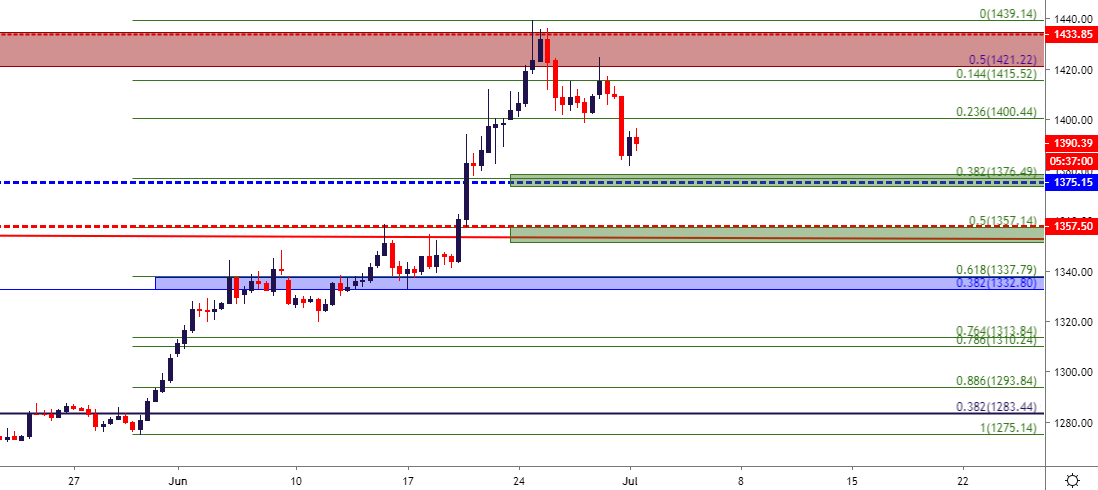
Chart prepared by James Stanley
Gold Price on a Short-Term Basis
Since that resistance came into play last week, gold prices have been on their backfoot, continuing in a pattern of lower-lows and lower-highs. For traders looking at bigger-picture reversals, or for traders looking to treat the matter from a short-term vantage point, there could be some continued scope for further losses on a near-term basis, particularly until the bigger-picture zones of support looked at above might come into play. This opens the door to short-side potential down towards 1375 and then 1357.50. Key for that theme will be a hold of resistance around that 1400 area on the chart, which can keep the door open for short-term bearish trend strategies in Gold.
Gold Price Hourly Chart

Chart prepared by James Stanley
To read more:
Are you looking for longer-term analysis on the U.S. Dollar? Our DailyFX Forecasts have a section for each major currency, and we also offer a plethora of resources on Gold or USD-pairs such as EUR/USD, GBP/USD, USD/JPY, AUD/USD. Traders can also stay up with near-term positioning via our IG Client Sentiment Indicator.
Forex Trading Resources
DailyFX offers an abundance of tools, indicators and resources to help traders. For those looking for trading ideas, our IG Client Sentiment shows the positioning of retail traders with actual live trades and positions. Our trading guides bring our DailyFX Quarterly Forecasts and our Top Trading Opportunities; and our real-time news feed has intra-day interactions from the DailyFX team. And if you’re looking for real-time analysis, our DailyFX Webinars offer numerous sessions each week in which you can see how and why we’re looking at what we’re looking at.
If you’re looking for educational information, our New to FX guide is there to help new(er) traders while our Traits of Successful Traders research is built to help sharpen the skill set by focusing on risk and trade management.
--- Written by James Stanley, Strategist for DailyFX.com
Contact and follow James on Twitter: @JStanleyFX


