


Support and resistance lies at the heart of technical analysis. There are numerous forms of support and resistance, and not everyone will agree on how to spot important levels or even on how to use them. But what we discussed today should help start a foundation for new traders while also bringing to light perhaps some new angles for more experienced traders.
Whether you are a new trader building a foundation or an experienced trader struggling (happens to the best), here are 4 ideas to help you Build Confidence in Trading
Price, trend-line, and slope support and resistance
The main two types I use are price levels and trend/slope lines. Price levels are not really levels per se, but rather zones where within reason there are a number of inflection points, or touch points. The more swing highs and/or lows involved the better. Below is a good example of support which become more important with each touch.
Example of Support Becoming Increasingly important

Trend-lines are simple in concept but can be tricky in practice. For example, with an uptrend line; Do you connect the lows of the candlesticks (assuming you use candlesticks) or the closing prices, or some variation of the two where you can, again, within reason connect the most number of turning points? I take the latter most approach, connecting as many points within reason.
Also, look to see if there is a parallel to the trend-line in question which connects the other side of the trend; if there is one, then it strengthens the trend-line (see below). You may take a different approach, which is totally fine, but the key is – whatever you do, be consistent…
Trend-line(w/parallel) & 200-day w/key reversal
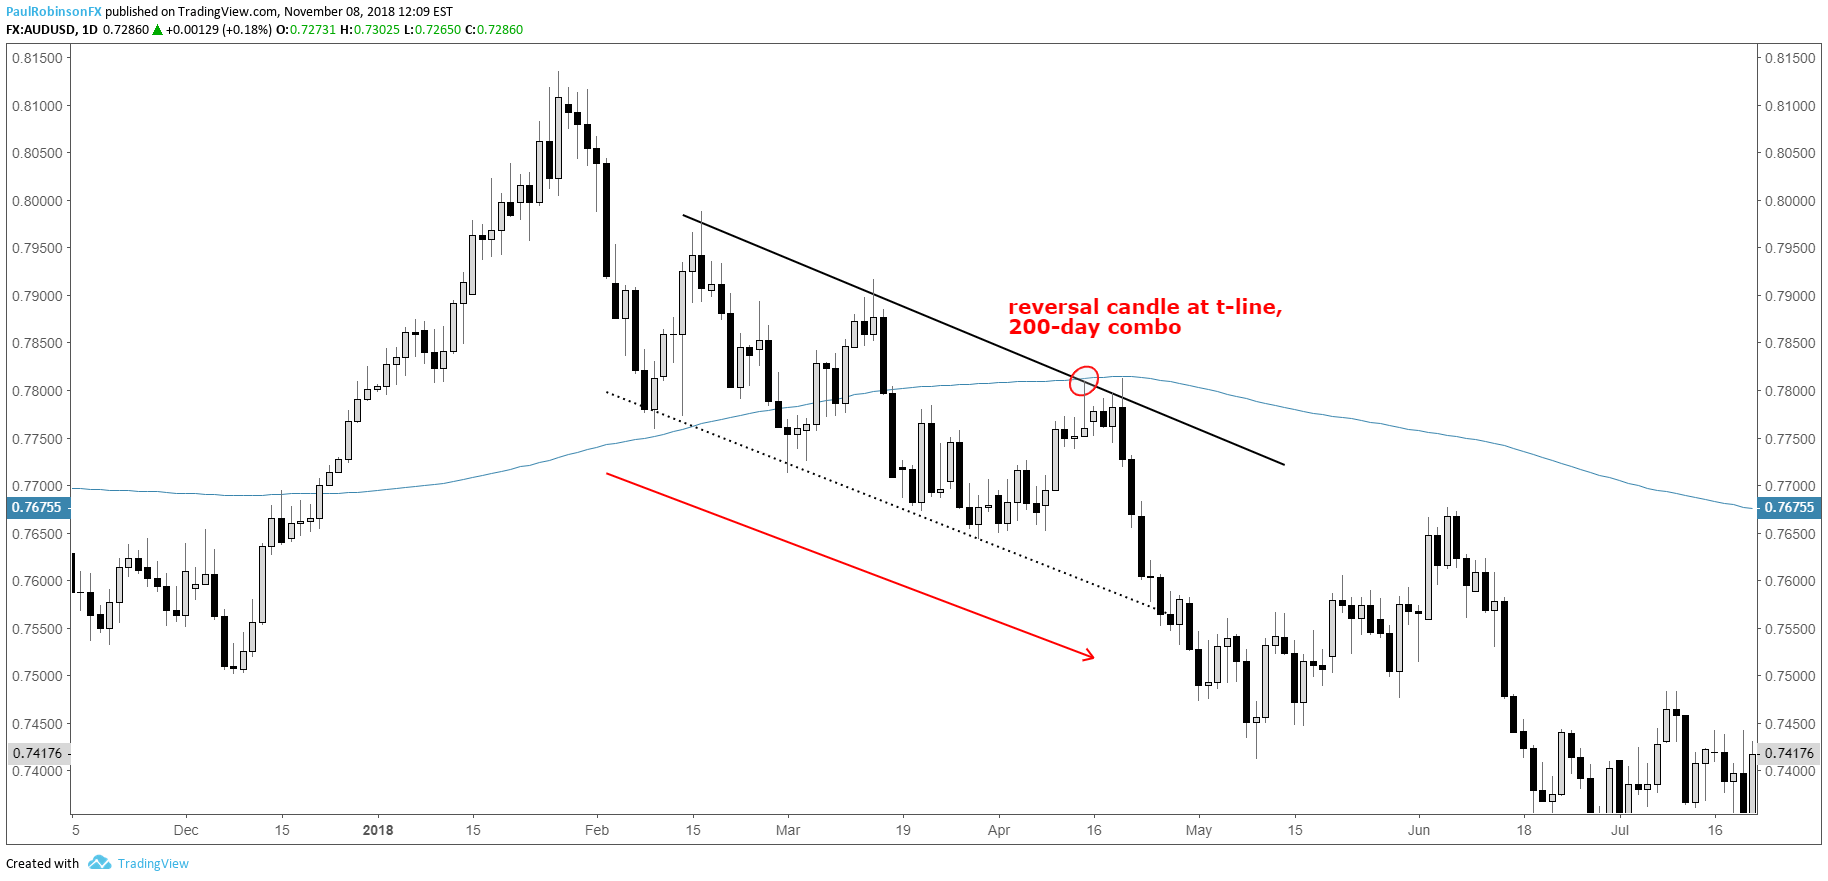
Slope lines are like trend-lines, but for the most part these are sort of ‘hidden’ as they can pass right through the middle of a lot of price action. Identifying slopes takes some time to learn. The key here is to make sure that you have several inflection points connecting, with each connection increasing the validity and importance of the slope.
Slopes as Support and Resistance

We understand the difficulties of trading, which is why we’ve put together a variety of guides designed to help traders of all experience levels.
Moving averages, Fibonacci, and others…
With regard to moving averages, I only use the 200-day due to how widely-watched it is. I’m often asked why I don’t use Fibonacci levels. It’s not because I don’t believe there isn’t validity, as I’ve seen too many traders use them successfully to write them off. It’s that I have found that often times the same retracement levels (i.e. 38.2%, 50%, 62.8%, etc.) that one trader is looking at will also align with the areas of support or resistance I find using price or trend/slope analysis. There is one form of support/resistance which I can't get on board with, though, and that is 'pivot points', derived by range data on the observed time-frame. Reason being, not a fan of Gaussian mathematics in the marketplace, and besides these seem to be more of a measure of volatility rather than actual support and resistance.
Some things to keep in mind
Here are some of the key points we discussed as important to remember when identifying support and resistance. Look for zones versus precise prices levels (markets aren’t generally very precise). The number of inflection points matters; the more there are the more important the area in question is. Seek out areas of confluence between more than one angle of support and resistance. If support is broken then it potentially becomes a new area of resistance, and vice versa. Using candlestick analysis can be a tremendous way to validate or invalidate the levels on your chart.
For the full conversation and examples, please see the video above…
Enjoy the video? Join Paul or any of the team’s analysts live each week for webinars covering analysis, fundamental events, and education.
Past webinars you might be interested in: Handling Drawdowns; Risk Management; Analysis, keeping it simple; 6 Mistakes Traders Make; Focusing on the Process; Building Consistency; Classic Chart Patterns, Part I; Classic Chart Patterns, Part II; Trading Breakouts; Trading Pullbacks; Combining Breakouts & Pullbacks
---Written by Paul Robinson, Market Analyst
You can follow Paul on Twitter at @PaulRobinsonFX


