


Today, we discussed two general types of breakouts – simple price level breakouts (support/resistance) and those involving various types of chart patterns. Not all set-ups are created equally, with some presenting more attractive risk/reward opportunities. We also discussed a few ways to enter a breakout trade which can help improve the overall risk profile, including where to logically place stop-loss orders.
Whether you are a new trader building a foundation or an experienced trader struggling (happens to the best), here are 4 ideas for Building Confidence in Trading
Price Breakouts
These set-ups emerge after a period of pulling back/consolidating amidst a trend orafter a prolonged period of price trading sideways (range). The trend breakout involves a trending market with a pullback followed by a breakout above the most recent swing high (for longs) or swing low (for shorts). The range breakout is simply identifying a period where the market has undergone an extended period of horizontal trading and price moves beyond resistance (long) or below support (short).
Price Breakouts (Bullish & Bearish)
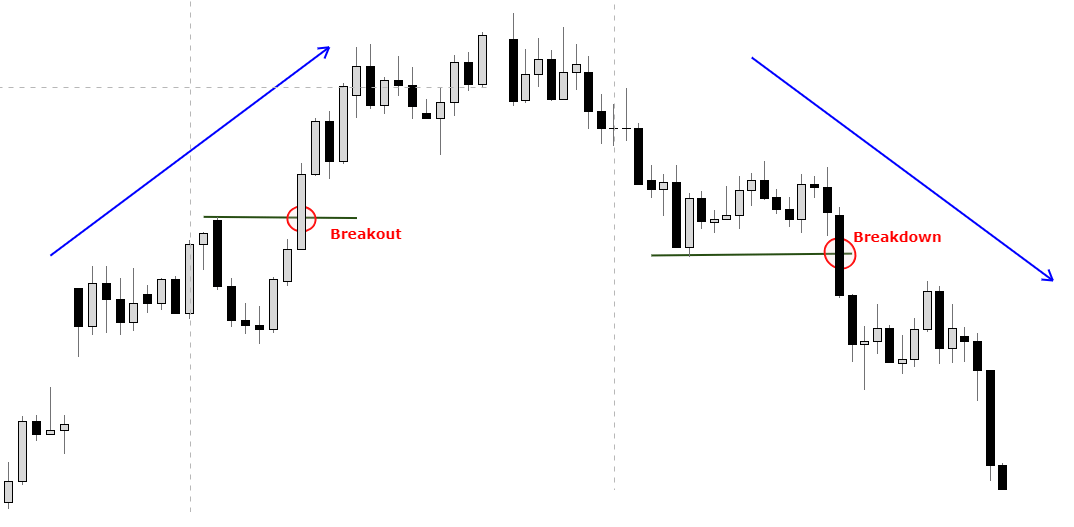
Chart Pattern Breakouts
This type of breakout occurs once an identified chart pattern matures. The basic formations we covered today – head-and-shoulders, wedges/triangles, rectangles, bull & bear-flags, and trend-lines (while t-lines aren’t considered a chart pattern, they do require a different approach than a simple price breakout).
Example of a Chart Pattern Break (Descending Wedge)

Entering a breakout signal
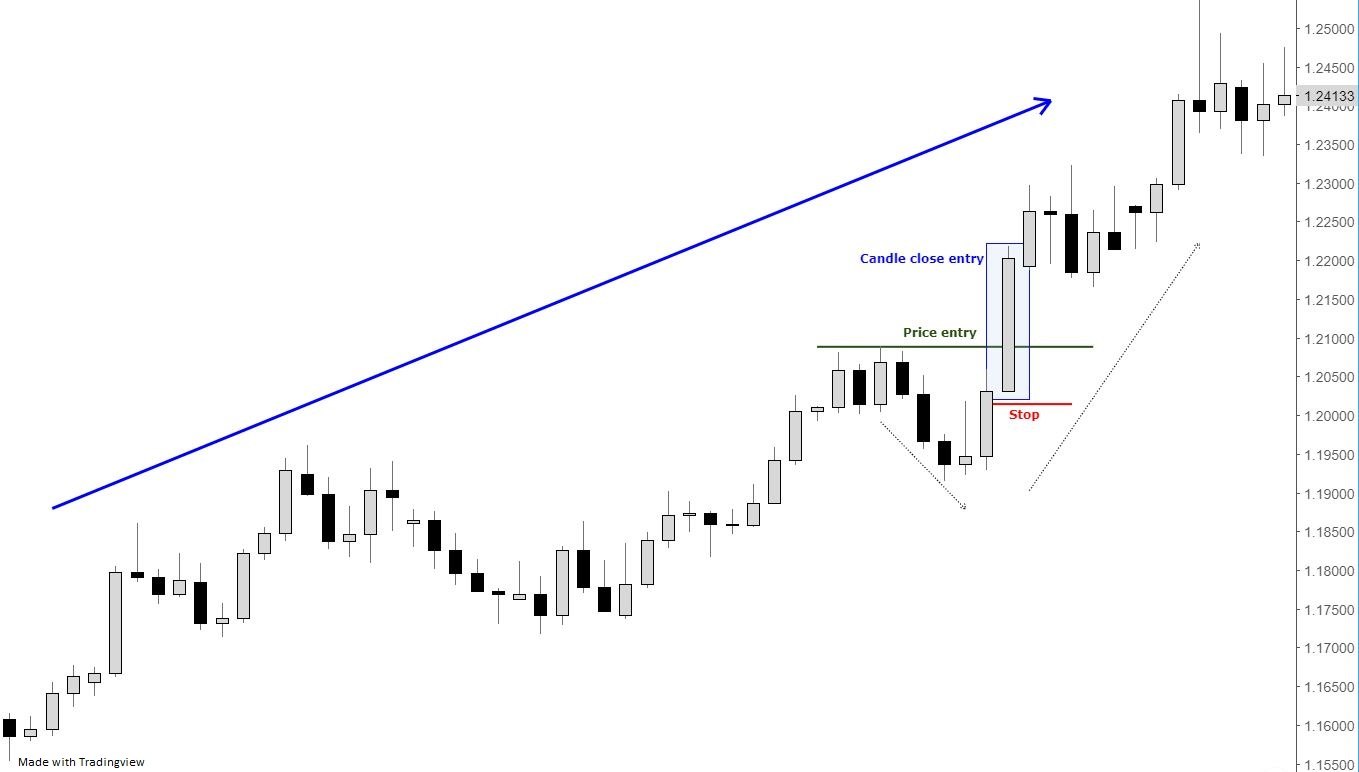
As with pretty much anything, there are multiple approaches which can be taken. One can enter the market as soon as the price level in question is crossed, wait until the candle closes beyond support or resistance, or some combination of the two. The closing candle method is the most conservative approach, but it can mean missing out on some or all of the move in the event the breakout is powerful. On the positive side it can also mean sidestepping losses at times when a breakout fails.
This is why combining the two execution strategies is a nice down-the-middle approach. For example, you enter 50% of your max position size as soon as a level is crossed and then wait for the confirming candlebeyond the price point in question beforeentering a full position. The benefit to doing this, is that in the event of an unconfirmed breakout you will lose only half of your normal risk, while in the event of a confirmed breakout you will have both a higher probability of success with larger profit potential due to the additional size.
We understand the difficulties of trading, which is why we’ve put together a variety of guides designed to help traders of all experience levels.
Example of Both Entry Types and Stop Placement
Risk management
As is the case with any trade, there must be good risk parameters in place. The distance from your entry point to anticipated target and distance from entry to stop-loss should have an asymmetrical profile which gives you a good risk/reward ratio (i.e. – 1:2+)
Stops should be placed sufficiently below resistance (for longs) and above support (for shorts), so as to be out of harm’s way. One of the best ways to achieve this is by utilizing the breakout candlestick. For example: If long, place the stop below the low of the confirming bullish candle. For shorts, place the stop above the high of the confirming bearish candle. (See example above.)
For pattern breakouts, given they are a little trickier, waiting for a closing candle outside of the pattern before entering is a prudent approach.
Targets should be determined using analysis first; that is, you should ask yourself where is the most logical point to which your trade could extend to? Looking at chart patterns, though, one can secondarily estimate the size of the move expected by using a measured move approach. This is determined by the size of the pattern, then added or subtracted from the breakout point depending on whether it is a bullish or bearish trade.
In Part II, we will discuss the pullback trade,as well as how to incorporate breakouts and pullbacks together, whether you trade them both or take preference to one strategy or the other.
Enjoy the video? Join Paul or any of the team’s analysts live each week for webinars covering analysis, fundamental events, and education.
For the full conversation and all examples, please see the video above…
Past recordings you might be interested in: Creating a Trading Plan; Handling Drawdowns; Risk Management; Analysis, keeping it simple; 6 Mistakes Traders Make; Focusing on the Process; Building Consistency; Classic Chart Patterns, Part I; Classic Chart Patterns, Part II
---Written by Paul Robinson, Market Analyst
You can follow Paul on Twitter at @PaulRobinsonFX


