


Chart patterns can be a powerful way to identify trading opportunities. In part I, we looked at reversal patterns, today we looked at neutral and continuation formations – triangles, bull/bear-flags, continuation head-and-shoulders, and rectangles.
Highlights:
- Triangles/Wedges (symmetrical, ascending & descending)
- Bull & bear-flags
- Continuation-style head-and-shoulders
- Rectangles, consolidations
Enjoy the video? Join Paul Tuesday-Friday each week – for details, please see the Webinar Calendar.
Triangles/Wedges
These types of patterns develop as a result of contracting volatility which portend price expansion upon breakout. There are three types – symmetrical, ascending, and descending.
Symmetrical triangles are the most neutral of the three variations as higher lows and lower highs converge towards the apex of the formation. If they develop early in a trend they tend to act more as an indication of pending continuation of the trend prior to development, however; if they form after extended moves they are more prone to leading to reversals. In any event, as is the case with any one of the three variations, a confirmed breakout is needed before the pattern is set into motion, because these, especially, can go either way.
Ascending wedges are marked by higher lows and a flat top. They show that market participants are willing to step in at increasingly higher prices despite the market capped by resistance. While this indicates a bullish bias in an upwardly trending market, if they break to the downside then a top can form. Conversely if development comes after an extended downtrend and break to the top-side they can result in a bottom.
Descending wedges are marked by lower highs and a flat bottom. With this variation the market is indicating that sellers are coming in at lower and lower levels with increasing pressure on horizontal support. A break of the bottom of the formation in-line with the downward trend is a continuation-style pattern. If they form after an extended up-move, we see a break of the flat bottom, then they are topping in nature.
*For all three types, the target is determined by the taking the height of the pattern and adding or subtracting the distance from the breakout point. A ‘measured move target’ (MMT) should also be taken into consideration with other key levels on the chart.
Confidence is crucial to success, check out this guide for ideas on how to Build Confidence in Trading.

*Examples provided in the video.
Bull & Bear-flags
Bull-flags develop after a rally and occur as a result of gradual selling, but nothing significant enough to change the trend (also known as a ‘correction’). The downward channel which takes shape is eventually triggered by the market trading above the top-side trend-line. The extent of the move which the pattern projects is for a new swing-high to develop at the least, and the measured move target is the depth of the pattern added to the point of breakout.
Bear-flags develop after a sell-off and occur as a result of gradual buying, but not enough to change the bearish trend (aka, ‘correction’). The upwardly sloped channel is eventually triggered by a move below the lower trend-line which makes up the underside of the pattern. In reverse of the bull-flag, a move to a new swing-low is targeted, with the ‘MMT’ determined by the depth of the formation subtracted from the breakout point.
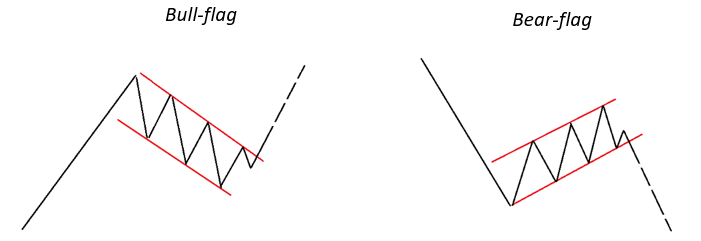
*Examples provided in the video.
Continuation-style ‘Head-and-shoulders’
While traditionally head-and-shoulders are thought of as reversal patterns (which we discussed in Part I), they can form in the direction of a trend and act as continuation patterns. These can also take on the shape of an ascending wedge in an uptrend and a descending wedge in a downtrend. In any event, the implications are the same. The measured move target is the distance from the head to the neckline added or subtracted from the neckline depending on whether it is a bullish or bearish sequence. Again, other technical levels should be taken into consideration when determining targets.
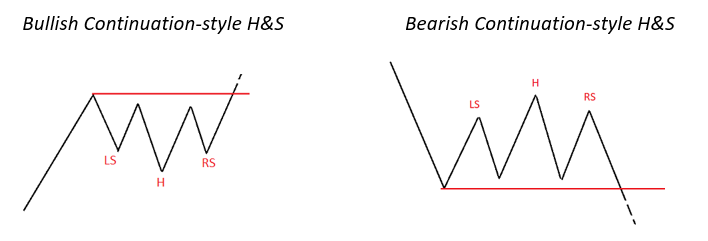
*Examples provided in the video.
Rectangles (consolidations)
This is a very simple pattern, which until either side of the range (or consolidation) is broken is to be avoided. Trading in the middle of the range isn’t prudent. These are often considered continuation patterns, but if they develop after an extended trend and break in the opposite direction, they can mark a top. As is the case with all technical patterns, the size of the pattern determines the measured move target once a breakout occurs.

*Examples provided in the video.
For the full lesson, please see the video above…
Prior ‘Becoming a Better Trader” webinars you may be interested in: Classic Chart Patterns, Part I, Analysis, keeping it simple; Using a Checklist; Risk Management; Handling Drawdowns; 6 Mistakes Traders Make; Focusing on the Process; Creating a Trading Plan
---Written by Paul Robinson, Market Analyst
You can receive Paul’s analysis directly via email by signing up here.
You can follow Paul on Twitter at @PaulRobinonFX.


