


Since the beginning of February, I’ve spoken with quite a few traders that are left puzzled as far as market direction. Now we’re starting to see major news media outlets reporting about ‘directionless markets.’ This is how we know the theme has become pervasive.
In DailyFX Bootcamps, we discuss current markets and potential opportunities and strategies in-depth with attendees from San Francisco, to Dallas, to New York; and after the last Bootcamp it became clear that many traders would just assume to wait for the ‘bigger moves’ that the market MIGHT eventually make.
This article is going to teach you another way of addressing this type of confusion and indecision. Rather than just wait around and *hope* that the market breaks out and begins to give us something that might fit a trend strategy; we can, instead, look to trade what the market gives us with one of the best tools available on any chart: Price Action.
What is the ‘Parity Channel?’
Created with Marketscope/Trading Station
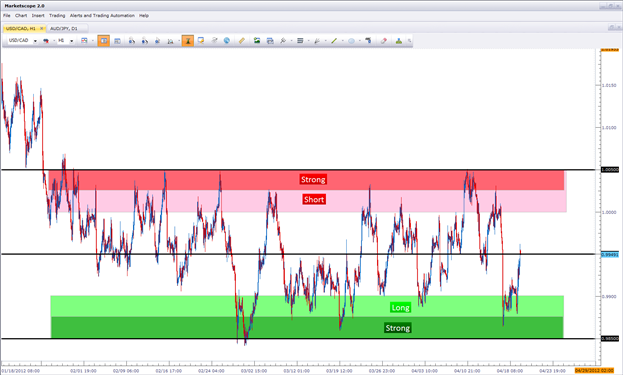
The parity channel is the price range that has developed on the USDCAD currency pair between 1.0050 and .9850. The reason for the name ‘parity channel’ is the fact that price parity between the two currencies in the pair (US Dollars and Canadian Dollars) is within this range.
In the above graphic, you will notice multi-colored layers of support and resistance, and these are based on two different factors: The ‘Psychological Numbers’ within this range, and the price action swings that had taken place since the latter part of January.
As a channel trader – I want to look to buy when price enters the Green Zone; although it would be preferable if price were to penetrate the ‘Strong’ portion of the Green Zone. And for Sells, I would be waiting for price to enter ‘The Red Zone,’ and once again – price moving into the ‘Strong’ portion of the Red Zone is preferable.
If price is not in a Green or Red Zone, I place no trade until a better opportunity arises in USDCAD.
How to Enter Trades with the Parity Channel
As we saw above, since price entered this range on January 25th, 2012 – nearly all prices have stayed between .9850 and 1.0050.
I can use this to my advantage in trading the Parity Channel. I can simply look to buy at prices of .9900 or less – and look to sell prices of 1.0000.
When I buy at a price less than .99 – I can place my stop just below the bottom of the channel (such as .9835); and I can place a limit order at least as far away as I have placed my stop. I want to make absolutely sure that I’m able to get a minimum 1:1 risk-to-reward ratio, in an effort to avoid The Number One Mistake that Forex Traders Make.
If I’m looking to sell, I only want to do so at a price of 1.00 or greater; and I can then look to place my stop above the channel at a price slightly higher 1.0050 (such as 1.0070).
We can take the same graphic we saw above, and include the rudiments of our strategy to get the setup below:

Created with Marketscope/Trading Station
How to Incorporate Price Action
The market will rarely make a linear move up or down.
There may be a gap or a fast move, but in many cases; markets will oscillate during trends in a manner similar to what they may do during ranges.
However, during up-trends, price will often make ‘higher-highs’ and ‘higher-lows;’ or during down-trends price will make a series of ‘lower-lows,’ and ‘lower-highs.’ We looked at this topic in-depth in our price action swings article.
Despite the fact that we are looking to trade a range as opposed to a trend, we can use this to our advantage.
Lets say that price had just entered under our .99 ‘buy’ zone. I can buy as soon as this happens; or I could try to be more exacting with my entry.
I can simply wait for price to ‘bottom out,’ establishing an intermediate-term ‘swing-low.’
Once the swing-low is established, I can simply wait for price to establish a ‘higher-low,’ and once that is seen – I can use that to trigger into the trade.

Created with Marketscope/Trading Station
--- Written by James B. Stanley
To contact James Stanley, please email Instructor@DailyFX.Com. You can follow James on Twitter @JStanleyFX.
To join James Stanley’s distribution list, please click here.
Treasuries Part 1 – A History of US Debt
Treasuries Part 2 – How & Why Treasuries Matter to FX Traders
Treasuries Part 3 – How Treasuries Impact Forex Capital Flows


