


Price Action, an Introduction
Technical Analysis is the process of using the price chart itself to assist in trading decisions. While this may sound initially confusing, please let me explain.
The price chart, reflecting all changes that have happened to price within a specified period, can be looked at another way; the price chart can also be considered a gauge of trader’s sentiment during that same specified period.
As news came out that was bullish for the asset, the market prices that news accordingly to reflect a higher price. If news came out that was bearish, the exact opposite can be true, the chart will reflect losses to account for the incorporation of this new information.
Future events, which have not yet taken place, are unknown and as such, are not yet currently reflected in price.
The Technical Analyst operates under the presumption that the chart, at any point in time, reflects the sentiment of all known information in regards to that asset at that specific moment in time.
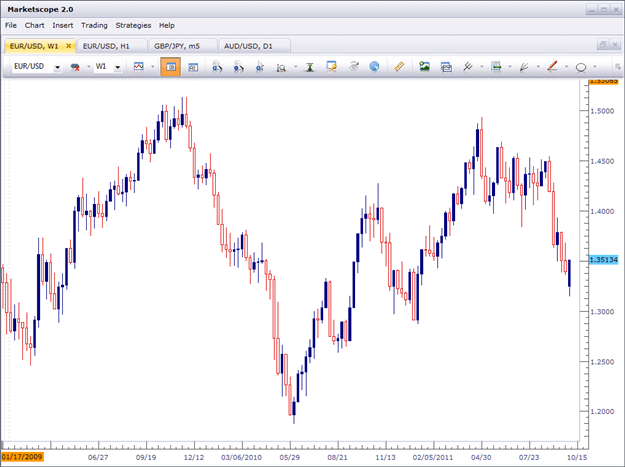
If the trader tries to read the price chart directly, it can often prove confusing. Price movements can, often-times, appear erratic and chaotic with little rhyme or reason. Below is a weekly chart of the EUR/USD currency pair. This chart, which contains an uptrend, a downtrend as well as an element of ‘congestion,’ could prove difficult for a trader to analyze. For more on Forex trading please take a look at our New2Forex Landing Page.
This is where indicators can help.
Indicators, based on past price information, can be added in an effort to assist the trader in making heads or tails of what is actually going on. The list of possible indicators to be used can go on for quite awhile, and there are a lot of different mannerisms in which indicators can come into play. But there is one universal concept that many Technical Analysts try to keep in mind:
No indicators or Trading Systems works 100% of the time.
Once again, we have to remember that price action, like any other future event, is unpredictable – especially when we’re using past price information to make those decisions.
This is where price action can help.
Price action is the process of using the price chart itself, without any indicators, to assist in trading decisions.
To get started, lets first look at one of the more pertinent areas of analysis: Trend identification.
Many traders, with the idea that future prices are unpredictable, simply try to use Technical Analysis to try to ‘get the odds on their side.’
Traders can attempt to identify their trend under the presumption that price, of recent, had shown a bias in one direction and that bias may, perhaps, continue. If price is in a down-trend, then traders can look to initiate short positions in an attempt to be on the correct side of this bias in price. If price is showing an up-trend, the exact opposite can be true; where traders are looking to Buy into long positions so that this bias may work for them to push their trades higher.
Below is the same chart we had looked at previously, a weekly EUR/USD chart, but this time we have 2 sections identified.
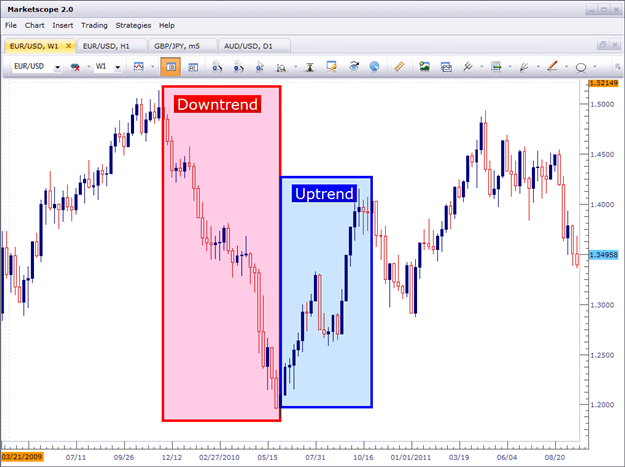
No indicators were needed to identify these trends; this was done entirely from the chart itself.
Notice that during the down-trend, price did not make a linear movement down in a straight line. Most of the movement can be explained by big moves down, followed by congested price action, followed by further moves down.
Below is the same chart, but this time we’ve went down to a Daily time-frame.
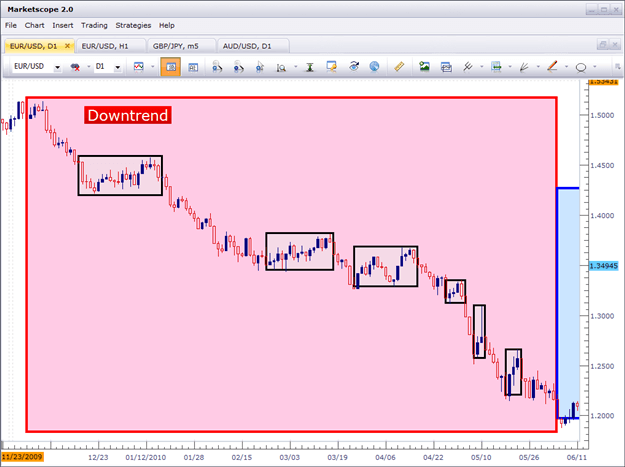
Each dark box identifies the periods of ‘congestion,’ during the downtrend.
As the trend began above 1.50, notice the quick movements made as the currency pair trends down. Shortly after piercing 1.45, a run of ~500 pips, the currency pair begins to display congestion; exhibiting price movements that disagree with the direction of the trend.
But these ‘counter-trend,’ price movements don’t last for long, as the currency pair, eventually, strives to even lower levels.
During these periods of ‘congestion,’ or ‘counter-trend,’ price movements, the trader can notice the rice swings displayed on the price chart. Below is our EUR/USD chart with swing-high’s circled in red.
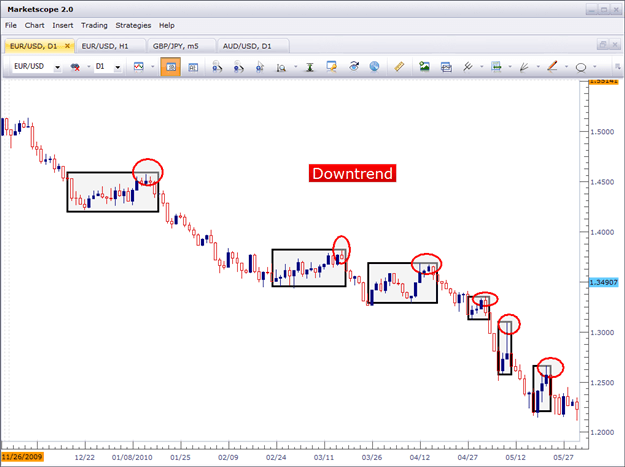
Did you notice something that was consistent amongst each of these ‘swings?’
Each swing-high is at a lower price than the previous swing.
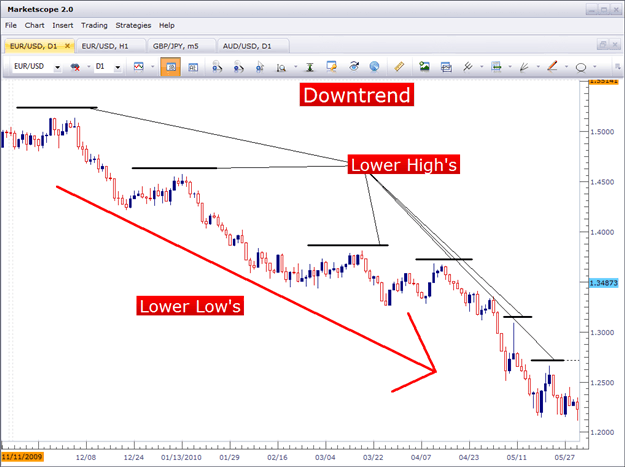
Lower-lows and lower-highs are being exhibited on the chart. And with this, I can then grade this as a ‘down-trend.’
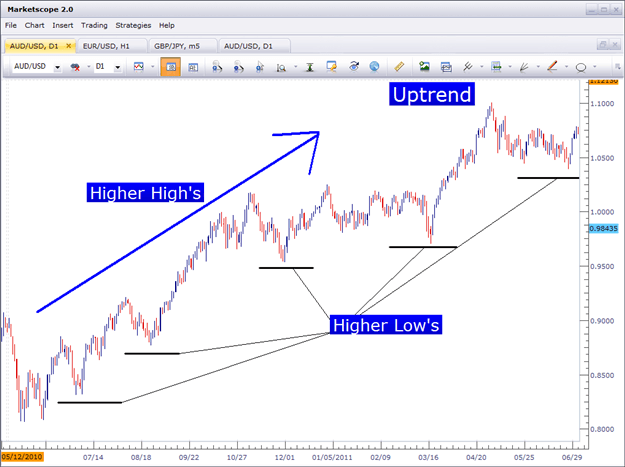
The exact opposite can hold true for Uptrends.
Over our next few price action articles, we’ll take a look at mechanisms that can be used to potentially trigger into trades in the direction of the trend.
Frequently Asked Questions (FAQs)
Which chart should I use, Candlestick, Bar or Line chart?
Careful analysis of charts is essential to forex trading. Before trading it is essential that you understand how to read the 3 chart types: Candlestick, Bar and line charts. This is explained further in our Introduction to Charting page which will equip you with the basics you need to make informed trading decisions in the forex market.
Next: How to Trade Trendlines (29 of 47)
Previous: How the Harami Candlestick Pattern Can Help You Catch Reversals
--- Written by James B. Stanley
You can follow James on Twitter @JStanleyFX.


