


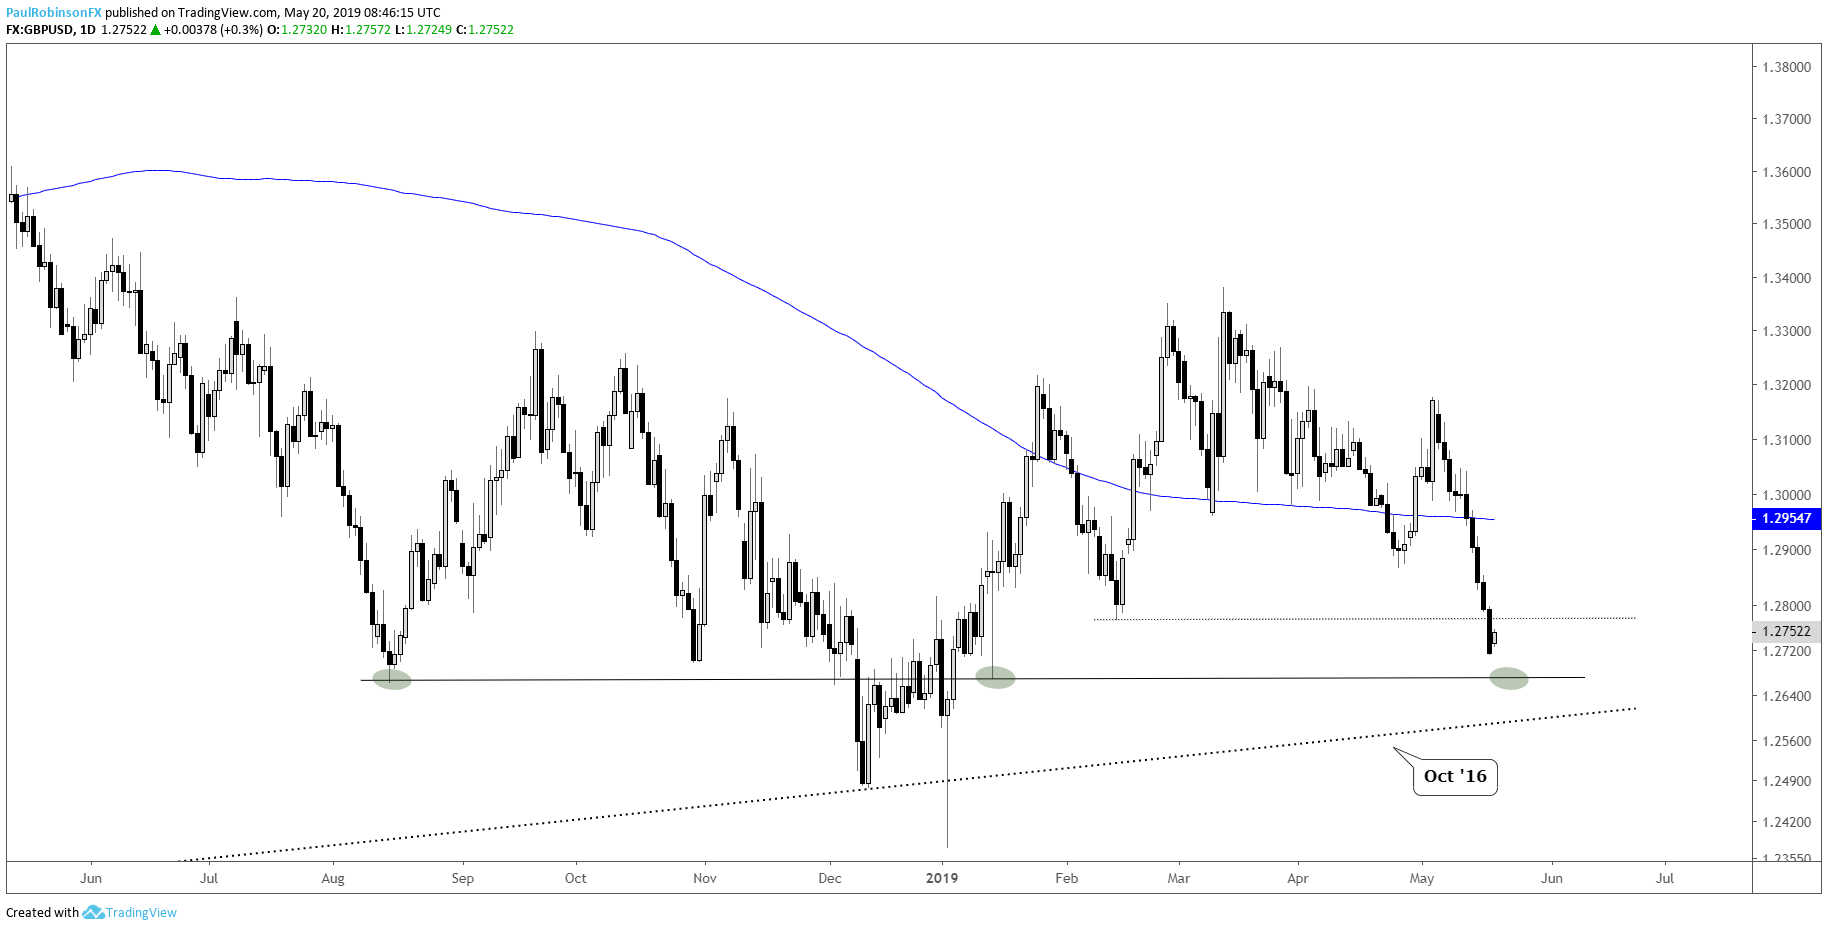
GBPUSD has big inflection point just below
Within less than 7 pips of one another, since August, a pair of important inflection points were created in GBPUSD. The low on August 15 was nearly matched exactly five months later on January 15 when cable was getting hammered before reversing strongly to post a key-reversal day.
The decline since popping on May 3 has been very steady, but when declines in GBPUSD are aggressive and look poised to continue on indefinitely (or rises for that matter) they are often met with reversals or strong counter-trend moves at the least.
Between this tendency and the key level just below, GBPUSD is on the radar as a reversal candidate should we see it touch the 12660s and start flexing its muscles. If not from there then pay attention to the area just below as a trend-line runs over from the October 2016 flash-crash low.
See what fundamental factors are in play for GBPUSD in the Q2 GBP Forecast.
GBPUSD Daily Chart (12660s big line)
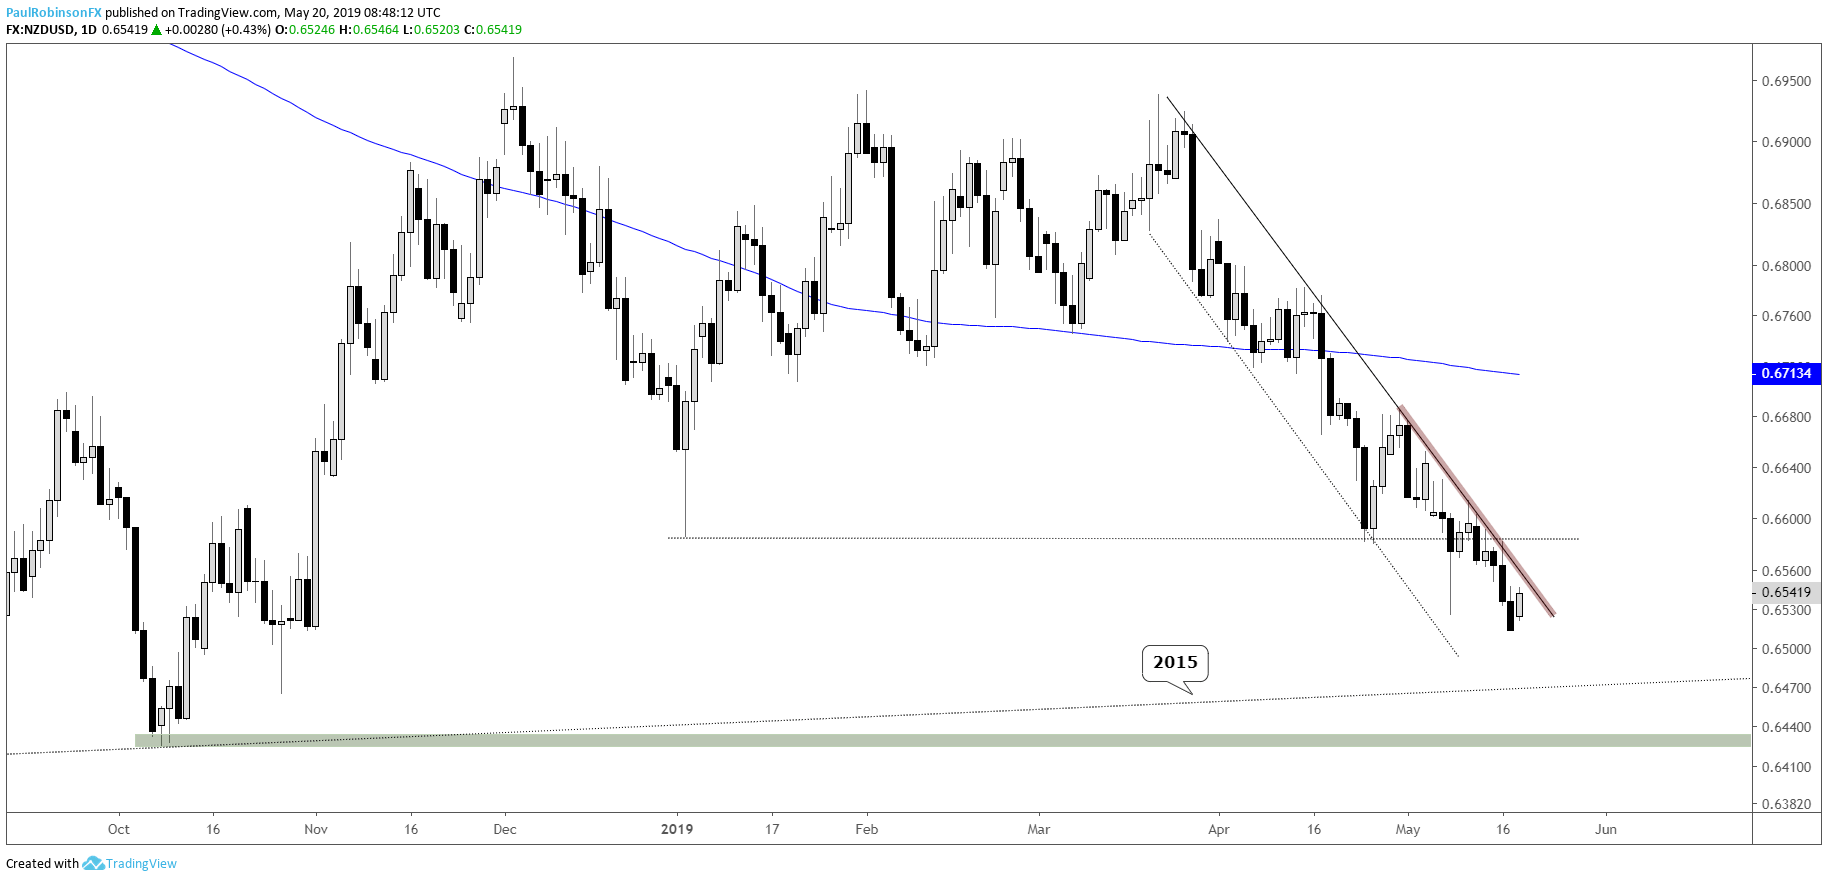
NZDUSD stuck in bearish channel, but has support
NZDUSD has been declining in an orderly fashion within the confines of a channel running off the March high. For as long as it remains inside the channel the outlook is neutral to bearish. A break outside of it doesn’t turn the picture bullish, but would be reason for pause on a bearish bias. Not far below is a long-term trend-line passing over from 2015; keep an eye on this line as a potential source of sizable support. A strong hold of this trend-line and break of the channel may offer a reason to turn constructive.
NZDUSD Daily Chart (Bearish inside channel)
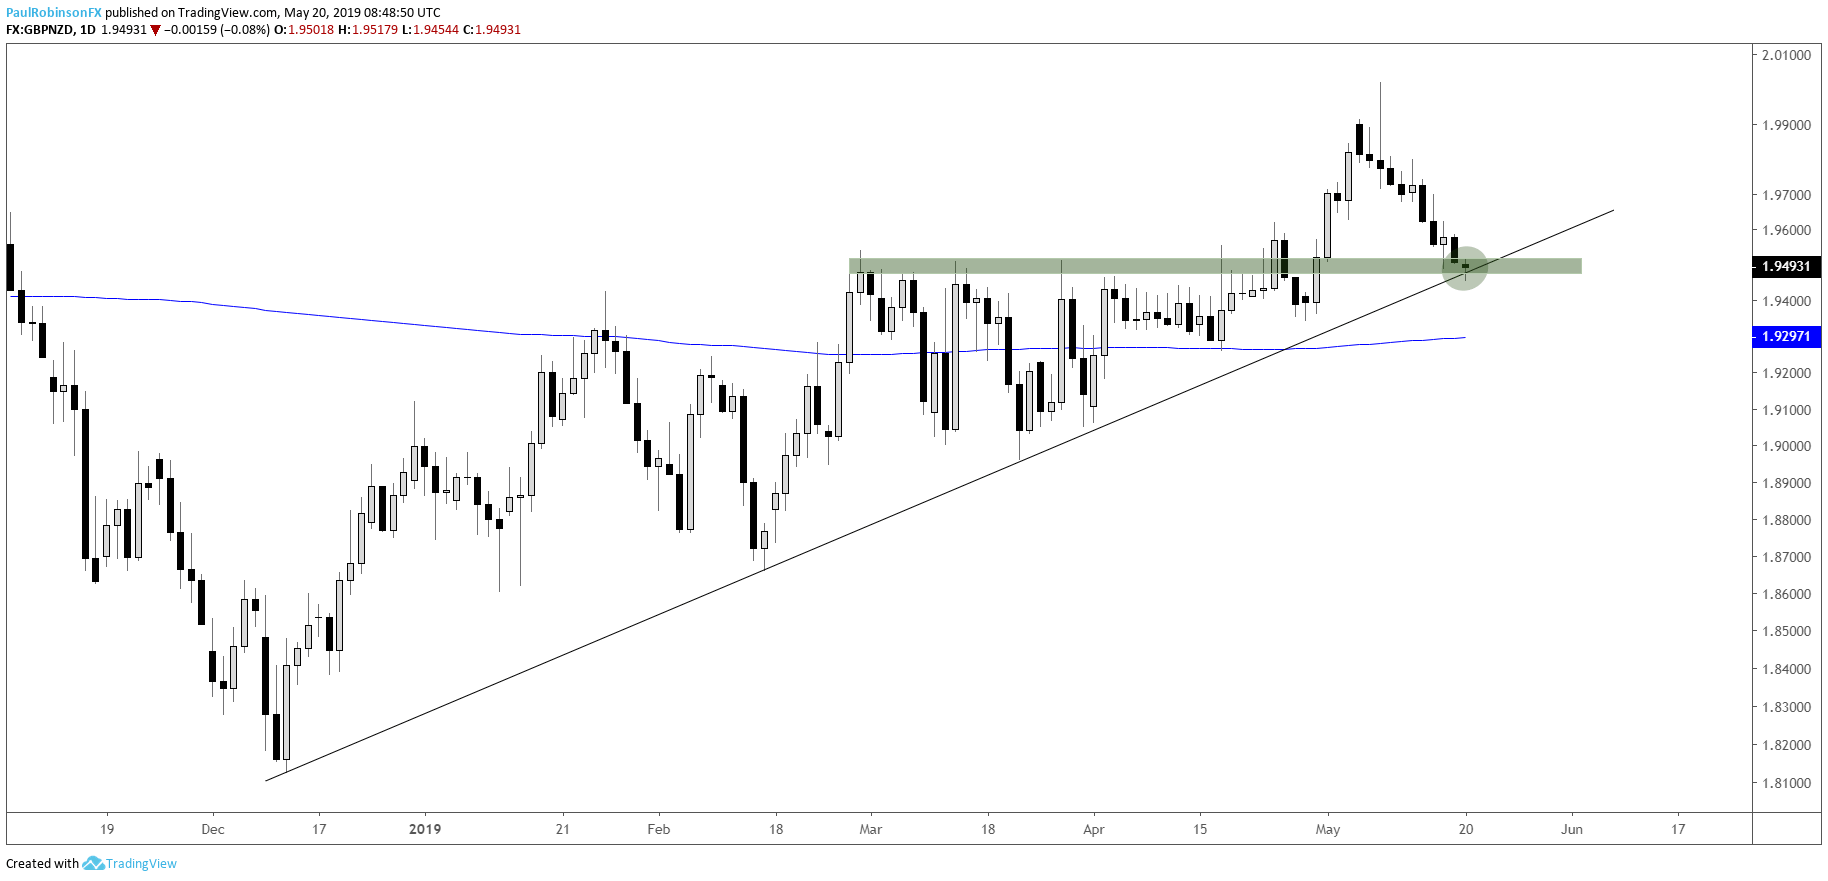
GBPNZD is trading at support
GBPNZD is dropping into an area of support of varying degree; rising from the south is a trend-line off the December low and horizontal support arrives from levels created during the March/April range. A turn higher will need to develop very quickly, otherwise a larger decline could be in store. A strong shove off support here may offer up a reason to look for GBPNZD to continue its multi-month move higher. Will it be GBP or NZD or both to help or hurt this set-up? Don't know, just focusing on the techs in the cross itself...
GBPNZD Daily Chart (watch price action here)
***Updates will be provided on these ideas and others in the trading/technical outlook webinars held at 9 GMT on Tuesday and Friday. If you are looking for ideas and feedback on how to improve your overall approach to trading, join me on Thursday each week for the Becoming a Better Trader webinar series.
Resources for Forex & CFD Traders
Whether you are a new or experienced trader, we have several resources available to help you; indicator for tracking trader sentiment, quarterly trading forecasts, analytical and educational webinars held daily, trading guides to help you improve trading performance, and one specifically for those who are new to forex.
---Written by Paul Robinson, Market Analyst
You can follow Paul on Twitter at @PaulRobinsonFX


