Check out our new Trading Guides: they’re free and have been updated for the first quarter of 2018
GBP/JPY Building a Base
GBPJPY looks likely to return back to its recent highs as the market continues to form a bullish base over the last two weeks. After retreating from the February 2 high of 156.620 to the recent February 14 low of 147.965, the market has stabilized with prices gently moving higher. The February 14 low also coincides with the Fibonacci 50% retracement of the August 2017 – February 2018 move, adding further credibility to its support.
At the bottom of the chart below, the stochastic indicator is has just turned positive and has plenty of room to move higher before it nears overbought territory – above 80. We note that the three EMA indicators are signalling further bearish behaviour in the pair and have put a slightly-below current market entry price for the trade and have kept our stop-loss tight.
Ahead of our targets, the pair may stall around 150.90, the February 21 high which also crosses with the 20-day and 100-day EMAs. A clean break through this level should allow GBPJPY to have a clear run at our first target at 152.50.
From a fundamental stance, data flow from Japan and the UK is low-middle importance, while in the UK ongoing Brexit talks could weigh on Sterling especially at the end of the week when EU Commission President Donald Tusk meets UK PM Theresa May, a day before the PM’s highly anticipated ‘Road to Brexit’ speech.
Chart: GBPJPY Price Chart Daily Timeframe (June 2017 – January 18, 2018)
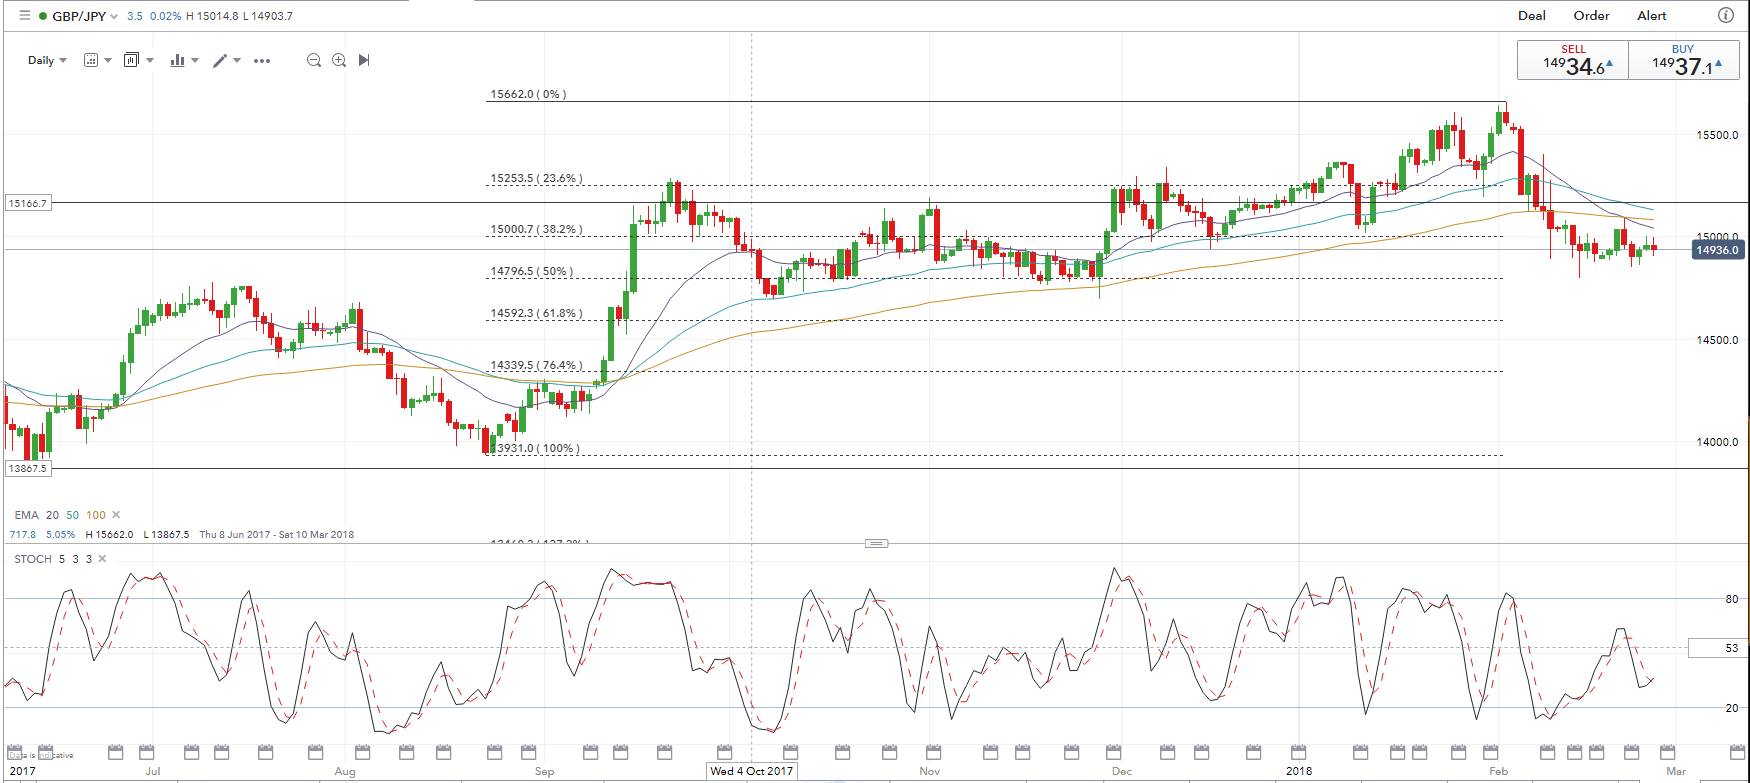
Entry Point: 148.55 (Market currently trading at 149.30).
Target 1: 152.50 – 23.6% Fibonacci Retracement.
Target 2: 154.00 – February 8 High.
Stop-Loss: 147.70 – Just below the 50% Fibonacci Retracement level.
--- Written by Nick Cawley, Analyst
To contact Nick, email him at nicholas.cawley@ig.com
Follow Nick on Twitter @nickcawley1