


Near-term Technical Outlook: Trade Setups on EUR/USD, AUD/USD & USD/MXN
- Technical charts on trade setup we’ve been tracking in EUR/USD, AUD/USD &USD/MXN
- Euro weekly opening-range set below key resistance
- Aussie fails third attempt to breach late-September highs
- USD/MXN inflection risk as sell-off tests critical support zone
An update on technical setups we've been tracking in Euro, Aussie & Peso. These are the targets and invalidation levels that matter heading into the close of the week. Review my latest Strategy Webinar for an in-depth breakdown of thesetrade setups and more.
Euro Price Chart – EUR/USD 120min
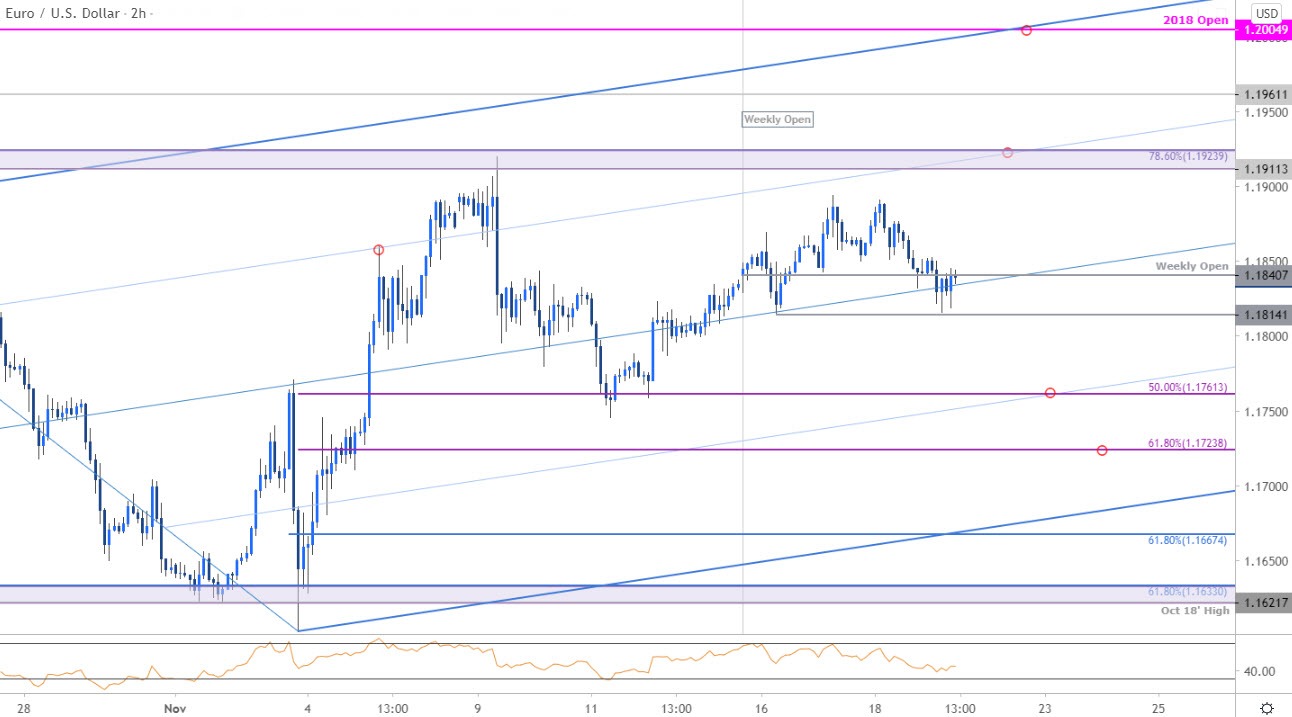
Chart Prepared by Michael Boutros, Technical Strategist; EUR/USD on Tradingview
In last week’s Euro Price Outlook we noted that, “the threat remains for a deeper pullback while below the weekly open at 1.1890 – look for topside exhaustion ahead of this threshold IF price is heading lower.” Euro registered a low at 1.1745 in the following days before rebounding with price once again carving a weekly opening-range just below key resistance at 1.1911/23.
Bottom line: Risk for further losses while below this threshold - initial support at the weekly range lows at 1.1814 with a break lower exposing 1.1761 and the 61.8% Fibonacci retracement of the November range at 1.1723 – look for a larger reaction there for guidance IF reached. A topside breach / close above 1.1924 is needed to mark resumption towards subsequent resistance objectives at 1.1961 and the upper parallel / 2018 yearly open at 1.2005.Review my latest Euro Weekly Price Outlook for a look at the longer-term EUR/USD technical trade levels.

Australian Dollar Price Chart - AUD/USD 120min

Chart Prepared by Michael Boutros, Technical Strategist; AUD/USD on Tradingview
In my most recent Australian Dollar Technical Price Outlook we noted that AUD/USD was trading into a key resistance zone and to , “be on the lookout for possible topside exhaustion with the immediate advance vulnerable while below the September high-day close.” The setup remains unchanged into the close of the week with Aussie attempting to break the weekly opening-range lows today.
Bottom line: Initial resistance steady at 7321/29 with the threat of topside exhaustion sub-7371. A break below the median-line here is needed to suggest a larger correction is underway towards 7222, 7166 and the 61.8% retracement at 7125- look for a larger reaction there IF reached. Review my latest Aussie Weekly Price Outlook for a look at the longer-term AUD/USD technical trade levels.
Australian Dollar Trader Sentiment – AUD/USD Price Chart

- A summary of IG Client Sentiment shows traders are net-short AUD/USD - the ratio stands at -2.04 (32.89% of traders are long) – bullish reading
- Long positions are 0.67% lower than yesterday and 10.31% higher from last week
- Short positions are2.90% lower than yesterday and 3.40% lower from last week
- We typically take a contrarian view to crowd sentiment, and the fact traders are net-short suggests AUD/USD prices may continue to rise. Yet traders are less net-short than yesterday and compared with last week. Recent changes in sentiment warn that the current AUD/USD price trend may soon reverse lower despite the fact traders remain net-short.
| Change in | Longs | Shorts | OI |
| Daily | 2% | 3% | 2% |
| Weekly | 29% | -46% | 0% |
Mexican Peso Price Chart – USD/MXN Daily

Chart Prepared by Michael Boutros, Technical Strategist; USD/MXN on Tradingview
In this month’s Mexican Peso Price Outlook we noted that USD/MXN that a weekly reversal had shifted the focus lower in price, “keeping the focus on the 2019 swing high at 20.2561 and the 78.6% Fibonacci retracement at 20.0752.” Price registered a low at 20.0329 last week before rebounding with USD/MXN once again approaching the 2019 high-day close / Fibonacci support at 20.0752/1360 – looking for inflection off this threshold.
Bottom line: USD/MXN is poised to mark an outside-day reversal lower today but keep price above key support. A good zone to reduce short-exposure / lower protective stops – a break / close below 20.0752 is needed to keep the short-bias viable towards 19.8794 and 19.6591. Initial resistance stands at last week’s high / the 75% parallel at ~20.6930 with a break above 20.8377 needed to shift the focus higher in USD/MXN.
For a complete breakdown of Michael’s trading strategy, review his Foundations of Technical Analysis series on Building a Trading Strategy
-Written by Michael Boutros, Currency Strategist with DailyFX
Follow Michaelon Twitter @MBForex


