


Japanese Yen, JPY Talking Points:
- The Japanese Yen caught some relief on the back of the July NFP report, which helped to perk up US yields.
- USD/JPY and GBP/JPY are showing some bullish potential: Meanwhile AUD/JPY and EUR/JPY could be going in the other direction with each clinging to recent bearish trends.
- The analysis contained in article relies on price action and chart formations. To learn more about price action or chart patterns, check out our DailyFX Education section.

Despite the slowing volatility in the early portion of this summer, it really does seem as though markets remain on edge. The big push point, of course, is the Fed, but there’s really more behind that as the world continues to struggle with Covid. In the US, where re-opening has been underway, a rise in numbers from the delta variant have produced some concern: Potentially more concerning are delta-plus and Lambda variants, the latter of which may be vaccine resistant.
Financial markets, nonetheless, continue to notch fresh all-time-highs as the Central Bank stimulus remains largely in full effect. We’ve seen taper from Australia and Canada but, to date, the US and the Federal Reserve remain pedal-to-the-floor on the accommodation front; and even with improving forecasts the expectation is for the Fed to stay loose and passive until the labor market will no longer allow.
We got a piece of evidence on that front this morning for the July Non-farm Payrolls report, which was really solid all-the-way around. The headline number beat with +943k jobs added last month, and we even had improvement in the unemployment rate (5.4%, from a prior 5.9%). This helped to boost a bit of confidence because one of the major recent concerns has been Treasury yields.

Despite the fact that the Fed got more hawkish in June via the dot plot matrix, US Treasury Yields have continued to fall, illustrating how market participants have been buying Treasuries even at extremely low yields. Such a signal is often foreboding, a hit on confidence as money managers and hedge funds onloading Treasuries is a sign that they think a) Treasury prices may continue going up (and yields down) and/or b) some stress may be around the corner at which point these investors will be happily invested in a safe haven asset that could still see some bids.
When Powell was asked of this at the July rate decision, he didn’t have much of an answer, instead assigning it to ‘technical factors.’ But this is one of the largest markets on Planet Earth and for a move of that magnitude to show, there’s a lot of money driving into that market and this isn’t an isolated scenario; it’s one of concern.
This also related to the Japanese Yen in the Forex market. The Bank of Japan remains with negative rates, as they have since 2016. When we have an environment of stronger rates in the US, as we had in the first quarter of this year – that can lead to a strong and decisive trend in the USD/JPY pair. Investors are simply buying a higher-yielding currency and using a lower-yielding currency to do it. But when that unwinds – when rates start going the other way – the reversal of that move can be fast and violent, similar to what had shown at the start of Q2 or Q3.
The July NFP report has helped to boost US Treasury yields and similarly, USD/JPY. Below I look into four price action setups in the Japanese Yen, largely with the aim of looking for trends that may not be quite as visible elsewhere.
USD/JPY
On the heels of this morning’s NFP report, USD/JPY is putting in a strong breakout at a big spot on the chart. The pair had built into a falling wedge pattern after setting a fresh high in the month of July, and with scope, this can even take on a similar form as a bull flag formation.
To learn more about falling wedges or bull flags, check out DailyFX Education
Around the resistance side of the falling wedge was also a Fibonacci level and the psychological level of 110.00. Bulls drove through all of that confluence, giving the appearance of a bullish breakout in the direction of the longer-term trend. This keeps the door open for bullish continuation scenarios in USD/JPY for next week. For next resistance levels, there’s a Fibonacci level at 110.67 after which we have a confluent zone around the 111.00 handle.
To learn more about Fibonacci or psychological levels, check out DailyFX Education
USD/JPY Four-Hour Price Chart
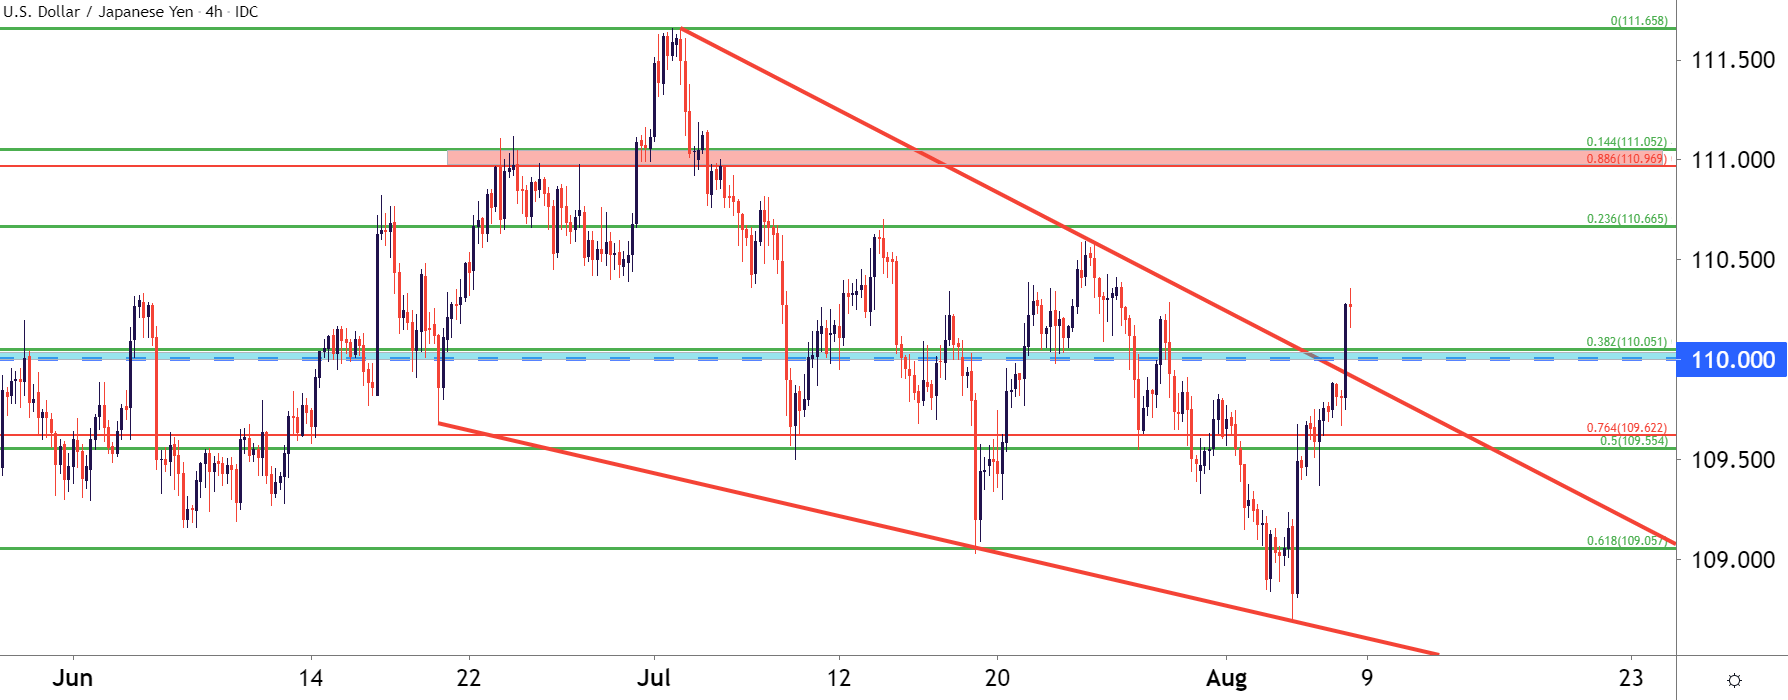
Chart prepared by James Stanley; USDJPY on Tradingview
GBP/JPY: Breakout Potential, Inverse Head and Shoulders Pattern
Perhaps even more interesting on the short side of the Yen is GBP/JPY. The pair has been similarly volatile around the rates theme of recent and after tanking down to 148.50 in late-July, bulls have been pushing for recovery in the pair.
At this point, price action has built into an inverse head and shoulders pattern. This opens the door for bullish breakout potential and this is probably one of the more interesting risk-on FX setups at the moment. The neckline plots around 153.50, and a breach beyond that opens the door for a bullish breakout towards the 155.00 psychological level.
To learn more about the inverse head and shoulders pattern, check out DailyFX Education
GBP/JPY Four-Hour Price Chart

Chart prepared by James Stanley; GBPJPY on Tradingview
EUR/JPY Grasping for Support
On the other side of the Yen, EUR/JPY seems to remain on its back foot. While robust recoveries have shown against both GBP and USD, EUR/JPY remains pinned towards a really big zone of long-term support, and the recent series of lower-highs remains in-effect.
For those that are looking for risk-off scenarios or for those that are looking for US yields to continue to drop, which could lead to further Yen-strength, the short-side of EUR/JPY can remain attractive. Prices are currently holding above a key Fibonacci level at 129.47 and a bit lower, at 128.52, is another Fibonacci level of note. A breach below that latter level opens the door for a run at the 127.50 psychological level, after which the 125 level is the next major area of potential support on the chart.

EUR/JPY Daily Price Chart
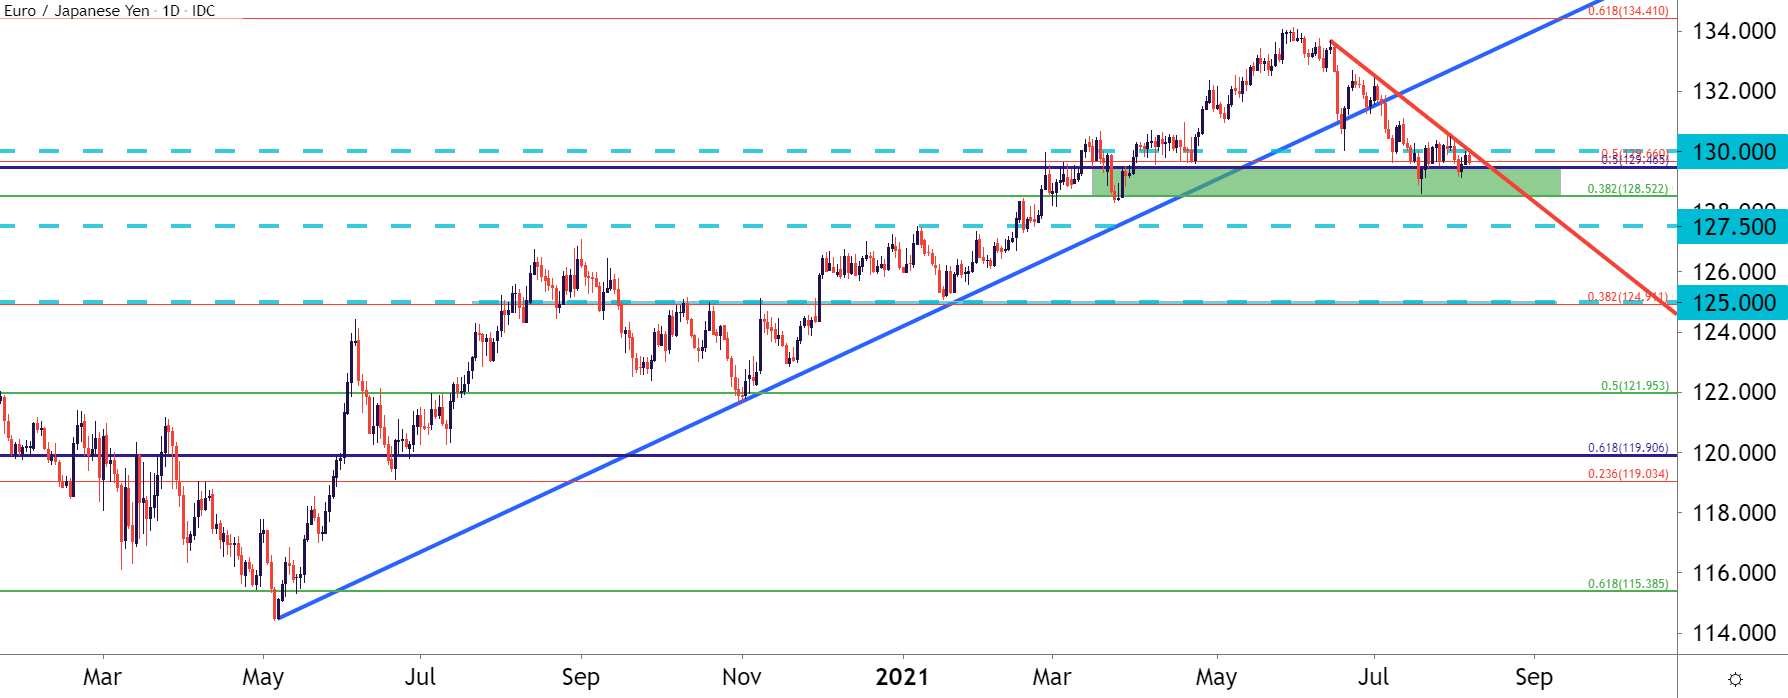
Chart prepared by James Stanley; EURJPY on Tradingview
AUD/JPY Holds at 80 Big Fig, for Now
Another market of potential interest on the long side of the Yen is AUD/JPY. Similar to EUR/JPY above, the pair retains bearish qualities even as Yen-weakness has reappeared against USD and GBP.
In AUD/JPY, current support is holding around the 80 psychological level, and this comes after the 85 level put in a tough fight to hold the highs from March to June of this year. Prices are currently nearing short-term resistance, taken from a Fibonacci level plotted around 81.48; but the recent series of lower-lows and lower-highs remains intact.
AUD/JPY holds breakdown potential going into next week, looking for a breach of the 80-handle to open the door for a move down towards 78, after which the confluent zone around 75 begins to come into play.

AUD/JPY Daily Price Chart

Chart prepared by James Stanley; AUDJPY on Tradingview
--- Written by James Stanley, Senior Strategist for DailyFX.com
Contact and follow James on Twitter: @JStanleyFX


