


Trading the Bearish Harami: Main talking points
The Bearish Harami consists of two candlesticks and hints at a bearish reversal in the market. The Bearish Harami candlestick should not be traded in isolation but instead, should be considered along with other factors to achieve Bearish Harami confirmation.
This article will cover:
- What is a Bearish Harami pattern
- How to identify a Bearish Harami on a trading chart
- How to trade the Bearish Harami candlestick pattern

What is a Bearish Harami pattern?
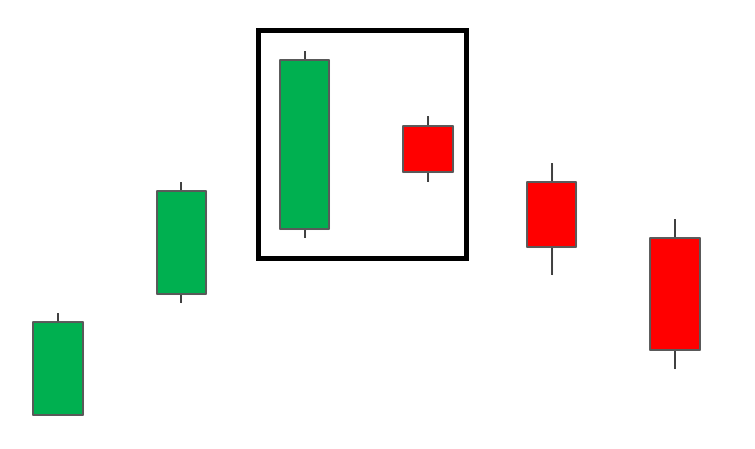
The Bearish Harami pattern is a reversal pattern appearing at the top of an uptrend. It consists of a bullish candle with a large body, followed by a bearish candle with a small body enclosed within the body of the prior candle. As a sign of changing momentum, the small bearish candle ‘gaps’ down to open near the mid-range of the previous candle.
The opposite of the Bearish Harami is the Bullish Harami and is found at the bottom of a downtrend.
How to identify a Bearish Harami on Trading Charts
Bearish Harami Checklist:
- Identify existing uptrend.
- Look for signals that momentum is slowing/reversing (stochastic oscillators, bearish moving average crossover, or subsequent bearish candle formations).
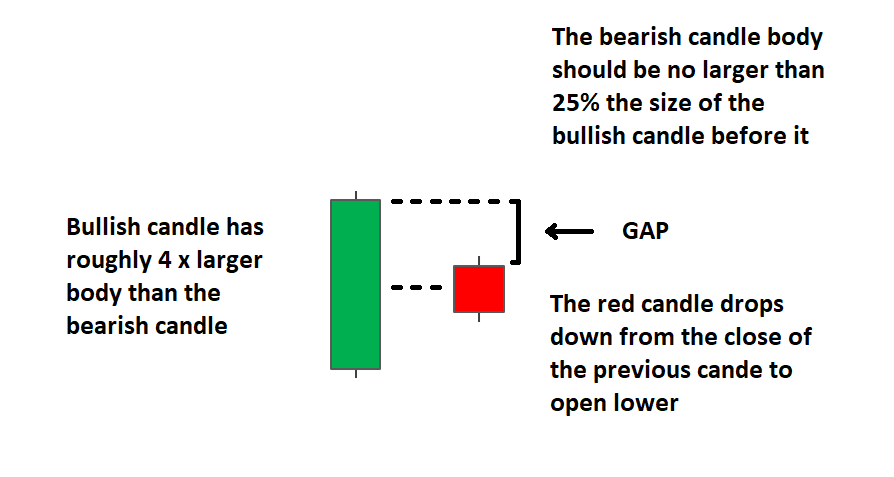
- Ensure that the body of the small red candle measures no more that 25% of the previous bullish candle. Stocks will gap down, showing the red candle mid-way down the previous candle. The gap is likely not found in forex candlesticks as they will mostly open at the same level as the prior candle’s close or very close to it.
- Observe that the entire bearish candle is enclosed within the length of the previous bullish candle’s body.
- Look for confluence with the use of supporting indicators, key levels of resistance or other supporting evidence to support the trade.
It's important to note, the Bearish Harami candlestick pattern will look different when observing it on a stock chart compared to the 24-hour forex market. Below we explore the formation of the pattern on both.
Formation of the Bearish Harami Pattern in the Forex market
The forex market operates on a 24/5 basis which means when one candle closes, another opens at virtually the same level of the previous candle’s closing price. This is often observed under normal market conditions but can change during periods of high volatility. The Bearish Harami pattern in forex will often look something like this:
The small red candle opens close to, or at the level that the prior bullish candle closed at. This is typically observed in the forex market.
Formation of the Bearish Harami Pattern in Stocks
Stocks on the other hand, have specified trading hours during the day and are known to gap down at the open for many reasons. Some of those might be:
- Negative company news released after the close of trade
- Country/sector data - viewed via an economic calendar - which is worse than expected.
- Regulatory changes that will negatively affect future earnings
- General (negative) market sentiment
Therefore, the more traditional Harami pattern appears, as seen below for FTSE 100 stock, Lloyds Banking Group PLC:
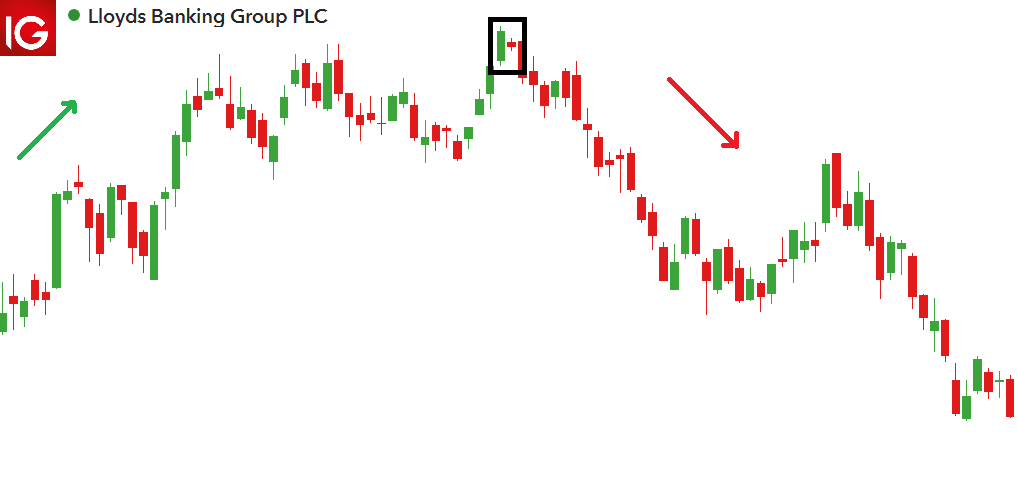
Notice how there are numerous areas on the chart where the market has gapped - showing wide open spaces between candles. This is often observed in the stock market.
How to Trade the Bearish Harami Candlestick Pattern
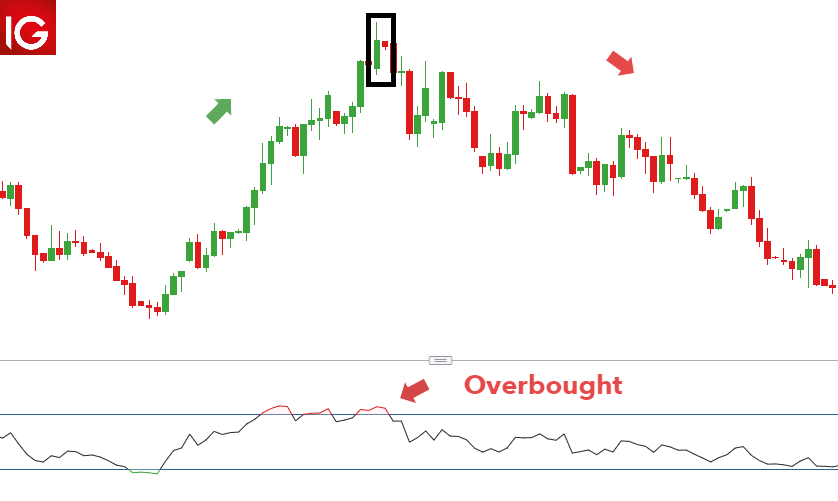
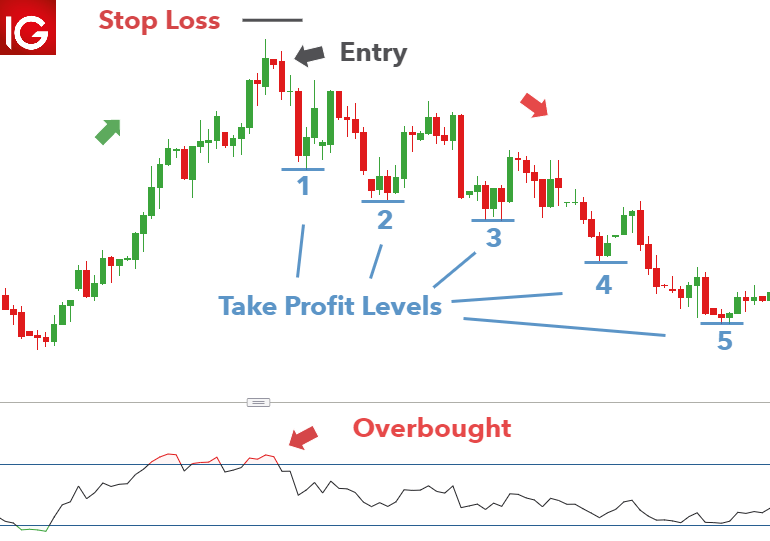
Traders can adopt the Bearish Harami 5-step checklist mentioned earlier in the article. Looking at the USD/SGD chart from earlier, we can observe the following:
- There is a clear uptrend.
- The RSI provides an indication that the market is overbought. This could mean that upward momentum is waning however, traders should always wait for the RSI to cross back over the 70 line for confirmation.
- The bearish candle is no more than 25% the length of the previous candle.
- The bearish candle opens and closes within the length of the previous candle.
- This Bearish Harami appears at a new high so traders should be aware that the market has turned lower from even lower highs previously. Subsequent price action also helps support the new downward momentum indicated by the Bearish Harami.
Stops can be placed above the new high and traders can enter at the open of the candle following the completion of the Bearish Harami pattern. Since the Bearish Harami appears at the start of a potential downtrend, traders can include multiple target levels to ride out a new extended downtrend.
How reliable is the Bearish Harami?
The validity of the Bearish Harami, like all other candlestick patterns, depends on the price action around it, indicators, where it appears in the trend, and key levels of resistance. Below are some of the advantages and limitations of this pattern.
| Advantages | Limitations |
|---|---|
| Attractive entry levels as the pattern appears at the start of a potential downtrend | Should not be traded based on its formation alone |
| Can offer a more attractive risk to reward ratio when compared to the Bearish Engulfing pattern | Where the pattern occurs within the trend is crucial. Must appear at the top of an uptrend |
| Easy to identify for novice traders | Requires understanding of supporting technical analysis or indicators. Popular: Stochastics and RSI |
Further Reading on Candlestick patterns
- Candlesticks form an important role in the analysis of forex trading. Learn How to Read a Candlestick Chart.
- If you are just starting out on your forex trading journey it is essential to understand the basics of forex trading in our New to Forex guide.
- Multiple candlesticks combine to form recognizable patterns. Test your knowledge with our forex trading patterns quiz!