


Bearish Engulfing Pattern: Main Talking Points
The bearish engulfing candle is one of the forex market’s most clear-cut price action signals. Many traders will use this forex candlestick pattern to identify price reversals and continuations to support their trading strategies.
This article will cover:
- What is the bearish engulfing candle?
- How to identify and interpret the bearish engulfing candle in forex trading
- How to trade forex with the bearish engulfing pattern
This article refers to candlesticks in great detail. Ensure you know how to read a candlestick chart
What is a Bearish Engulfing Pattern?
A bearish engulfing pattern produces the strongest signal when it appears at the end of an uptrend. The pattern is created by interpreting the data of two completed candles:
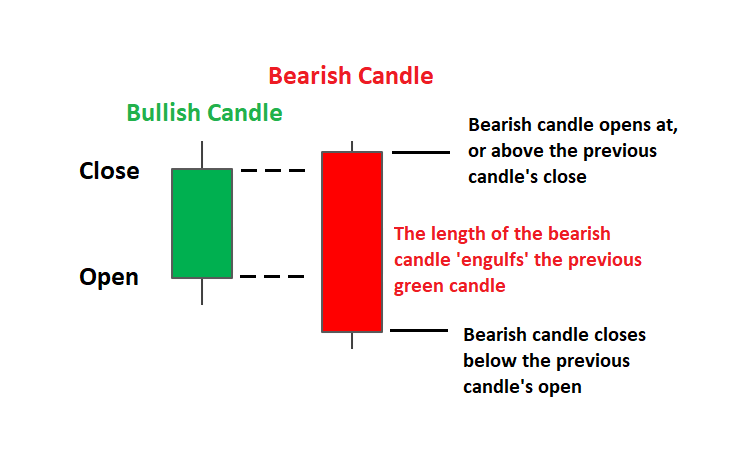
The first candle will depict the end of the established trend strength. It should be noted the size of this primary/bullish candle can vary but it is crucial that the body of this candle gets completely ‘engulfed’ by the candle that follows. Dojis and other small bullish candles provide the strongest signal as they can reflect market indecision in the current trend.
The second candle in the pattern is the reversal signal. This candle is comprised of a long red candle creating fresh downward price momentum. This bearish candle should open above the close of the previous candle and close well below the low of the previous candle. This strong downward movement reflects sellers overtaking buying strength and often precedes a continued fall in price. The further this secondary/ bearish candle declines, the stronger the signal becomes.
Know the Difference between a Bearish Engulfing Pattern and a Bullish Engulfing Pattern
Engulfing patterns can be bullish and bearish. The bullish engulfing pattern is essentially the opposite of the bearish engulfing pattern discussed above. Instead of appearing in an uptrend, it appears at the bottom of a downtrend and presents traders with a signal to go long. It is characterized by a red candle being engulfed by a larger green candle.
Bullish Engulfing Pattern
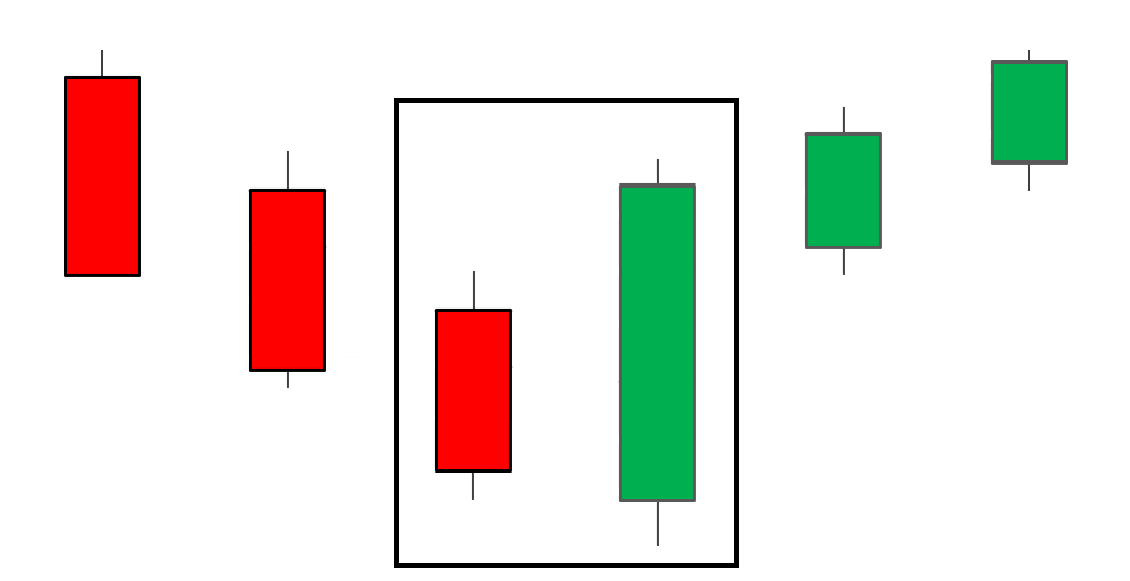
Below is a summary of the main differences between the bullish and bearish engulfing patterns. Traders should keep these in mind in order to avoid false signals.
| Engulfing Pattern | Characteristics | Location | Signal |
|---|---|---|---|
| Bullish Engulfing | Green candle engulfs previous (smaller) red candle | Appears at the bottom of a downtrend | Bullish signal (Bullish reversal) |
| Bearish Engulfing | Red candle engulfs previous (smaller) green candle | Appears at the top of an uptrend | Bearish signal (Bearish reversal) |
Find out more by reading our comprehensive guide on engulfing candlesticks.
Using a Bearish Engulfing Candle in Trading
Traders should always be on the lookout for trade confirmation by utilizing indicators, key levels of support and resistance, or any other technique that will support or invalidate a trade. Presented below are two approaches that traders can use to strengthen the bearish bias suggested by the bearish engulfing pattern.
Trading the Bearish Engulfing Candle Using Indicators
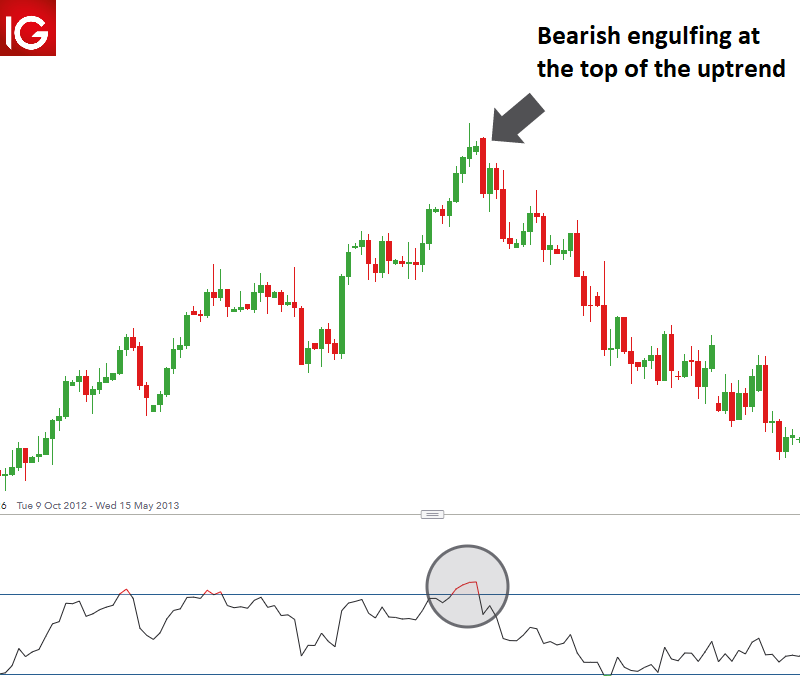
The example below highlights the bearish engulfing pattern appearing at the top of the uptrend on the EUR/USD daily chart. While it is not advisable to trade against the trend, in reality, reversals do occur, which is why all traders should be able to spot when this is likely to appear.
The chart shows the Euro appreciating and topping out at where the bearish engulfing pattern appears. Additionally, the Relative Strength Indicator (circled in black) validates the bearish bias with an ‘overbought’ signal.
Taking a closer look at the chart, entry levels, stops, and targets can be identified.
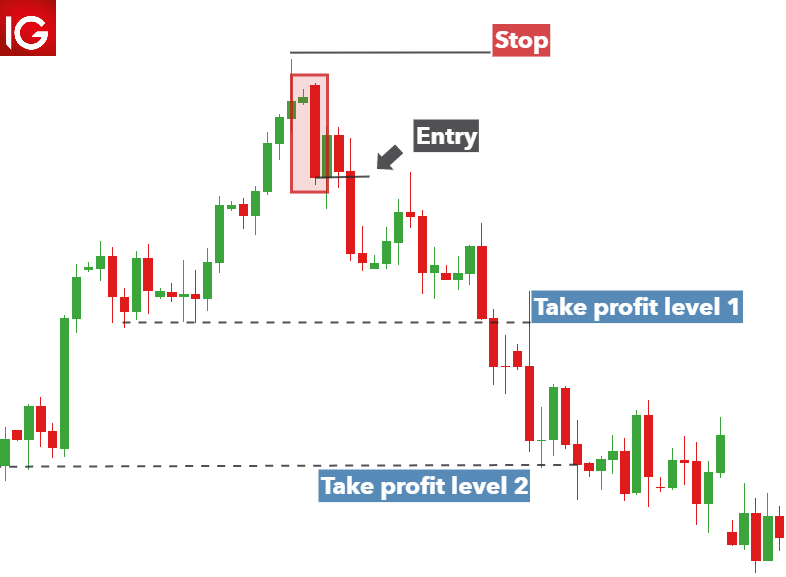
Entry: Traders can wait for a close lower than the low of the bearish candle or simply place working orders far below the low.
Stop loss: A stop can be placed above the recent swing high as this would invalidate the move and provides a sensible risk to reward ratio.
Target/ Take profit: Since bearish engulfing candles can indicate the beginning of a prolonged downtrend, it is helpful to consider an initial take profit level while remaining open to further downward movement. Adjust stops accordingly or consider using a trailing stop.
Trading the Bearish Engulfing Candle Using Support & Resistance
The chart below shows a bearish engulfing candle pattern appearing at resistance on the US Dollar Index (DXY). The level of support is important here because it shows that movements higher have been rejected previously. When the bearing engulfing pattern appears at resistance, it provides greater conviction towards a bearish bias.
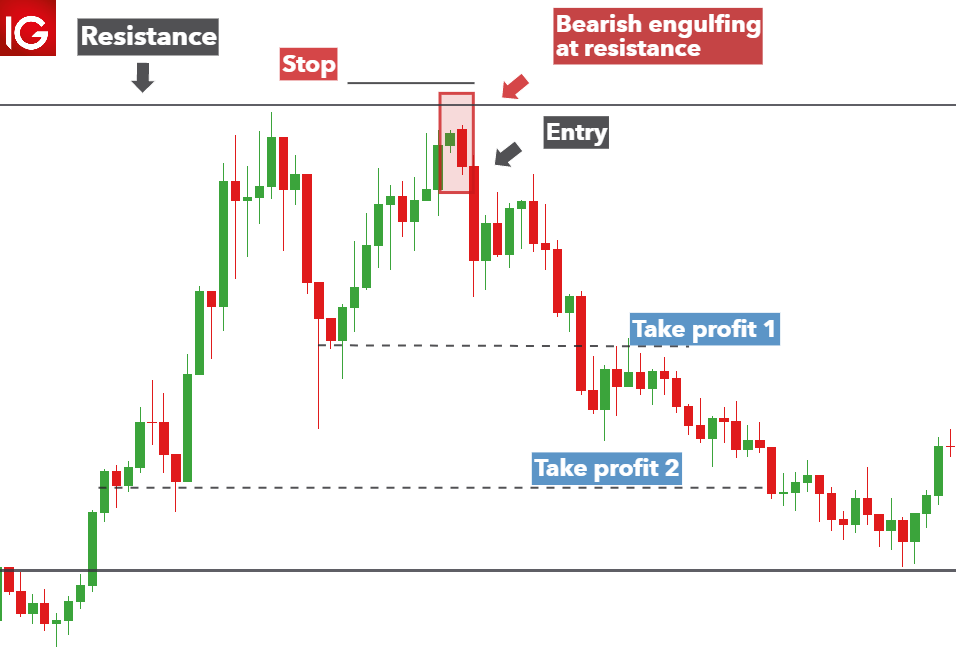
Entry: Considering the bearish engulfing is backed up by the level of resistance, traders may consider entering the trade at the open of the following candle.
Stop: The stop can be placed above the bearish engulfing candle and the level of resistance. A move above this would invalidate the move.
Target/Take profit: Targets can be set at a recent level of support. For the same reason as the above example, traders may consider a second target level - or implement a trailing stop - as the bearish engulfing candle may signal the start of a sustained downtrend.
Further reading on Candlestick Patterns
- For more information on trading the bullish and bearish engulfing patters, read our Engulfing Candle Patterns article.
- Traders should look for trade confirmation by utilizing indicators and levels of support and resistance, in order to make higher probability entries when trading the bearish engulfing pattern.
- The bearish engulfing is just one of many forex candlesticks. Find out what the Top 10 Candlestick Patterns are and how to trade them.