


Price action lies at the heart of technical analysis and is a simple, yet powerful way to identify trading opportunities. We examined in depth with examples the three main tenets of price action; trend, support & resistance, and market reaction.
Highlights:
- Price action analysis is a powerful way to isolate potential trading opportunities
- We look at how to identify the trend, support & resistance, and reaction signals for validation
- Tying it all together and arriving at trading decisions
Technical analysis is comprised of numerous disciplines, but at the foundation of it lies price action. There are three key components – trend, price levels (support/resistance), and the reaction of the market which can provide actionable signals.
If you're puzzled by trading losses, why not take a step in the right direction? Download our guide, "Traits of Successful Traders," and gain valuable insights to steer clear of common pitfalls that can lead to costly errors.

Trend
There are many indicators that can identify the trend and its strength, but what really defines a trend from a simple price standpoint is whether the market is making higher-highs and higher-lows (uptrend) or lower-lows and lower-highs (downtrend), or doing neither and thus creating a range.
Trends occur on all time-frames, but the general rule of thumb to follow is that the higher time-frame takes precedence over the shorter-term. For example, in FX using the daily and 4-hr is a solid combination for providing a comprehensive picture.
While an uptrend may be occurring on the 4-hr (short-term) there may be a downtrend unfolding on the daily chart (longer-term). In this case, more respect should be paid to the trend of the daily chart, with consideration that at some point the short-term trend may revert back in favor of the longer-term trend.
Example of an Uptrend
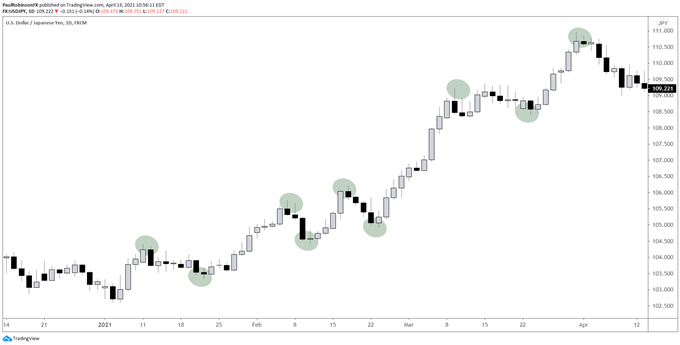
Created with TradingView
Example of a Downtrend
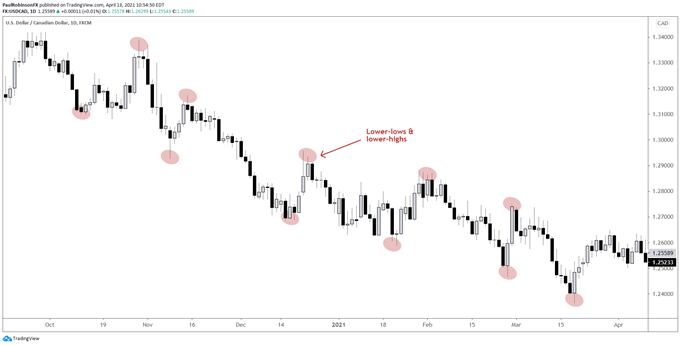
Created with TradingView
New to trading financial markets? Learn how to build confidence in trading. It's free!

Support and Resistance
The next important aspect to price action trading are price levels – support and resistance. Support is simply a point where demand (buyers) are keeping price supported, while resistance is a form of supply (sellers), a point where the market has failed to continue moving higher. There are numerous ways to identify these levels such as Fibonacci levels and moving averages, but the focus here is primarily on actual price levels, trend-lines, and slopes.
One important note – Confluence between varying angles of support and resistance makes for a stronger, more reliable level. For example, if you have a horizontal price level that intersects with a trend-line it makes for a stronger level.
Example of support and resistance
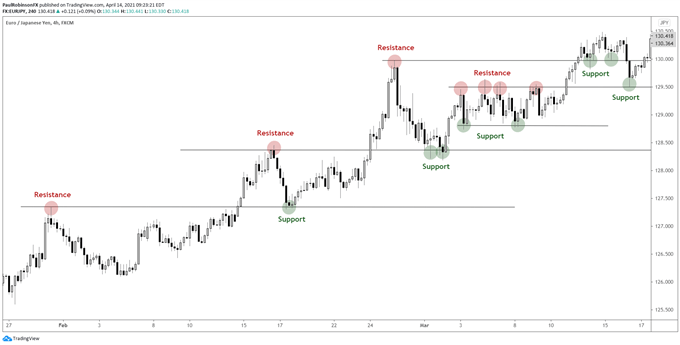
Created with TradingView
Example of confluence
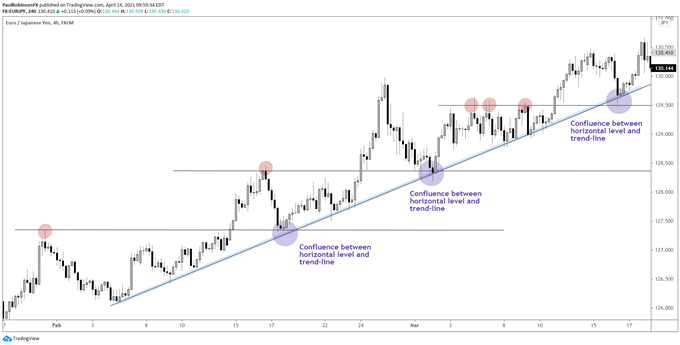
Created with TradingView
Market Reaction (Validation, Invalidation)
The third aspect to price action trading to consider, is how the market reacts to price levels within the context of the trend. Is the market displaying behavior that confirms or invalidates what we are seeing on the chart? This is where the rubber meets the road and a trading decision can be made.
A good way to gauge price action is by using candlestick analysis. Candlestick types that demonstrate a clear reaction, or rejection, are reversal candles (aka ‘pin’ bars, ‘shooting stars’, ‘bullish hammers’) and other powerful candles such as ‘engulfing bars’.
These candlesticks show a rejection away from the support or resistance in question, a change in momentum that demonstrates the willingness by the market to participate at key levels.
Once a turn is in place from support or resistance, we can use the swing-low (for longs) and swing-high (for shorts) to determine stop placement. It’s best to place your stop beyond the level in question to avoid getting picked off by a small move above or below the identified levels. Targets should allow for ample reward relative to the risk taken (as a general rule of thumb a 1:2 risk/reward ratio or better). Targets, like stops, should also be based on your analysis and not a random figure determined by how much you wish to make.
Example of powerful reversal around resistance
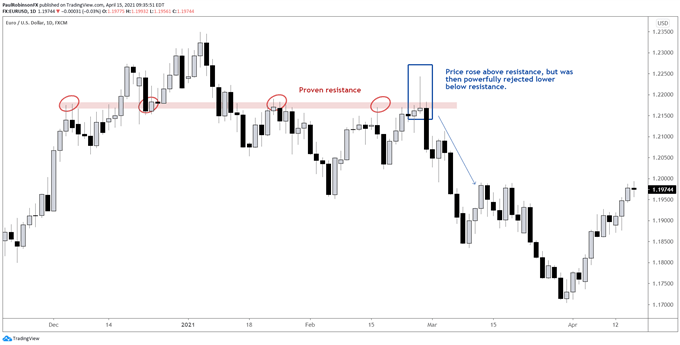
Created with TradingView
For the full conversation and set of examples, please see the video above…
---Written by Paul Robinson, Market Analyst
You can follow Paul on Twitter at @PaulRobinsonFX.
Curious to learn how market positioning can affect asset prices? Our sentiment guide holds the insights—download it now!
