


US Dollar, Japanese Yen, USD/JPY - Technical Outlook:
- USD/JPY is risking a minor setback.
- The pair has run into a significant long-term resistance
- How deep could a potential retreat be, and what are the key levels to watch?

USD/JPY SHORT-TERM TECHNICAL FORECAST – NEUTRAL
Tuesday’s retreat from key intraday resistance has raised the odds of a minor setback in USD/JPY.
Notwithstanding the recovery in the New York session, USD/JPY continues to hold below key resistance at the October 25 high of around 149.00. This follows a solid bearish reversal on October 21, which came about from a major resistance area: the 1998 high of 147.65, coinciding with the 200-quarter moving average and the upper edge of a rising channel from 2012 (see chart).
USD/JPY Quarterly Chart
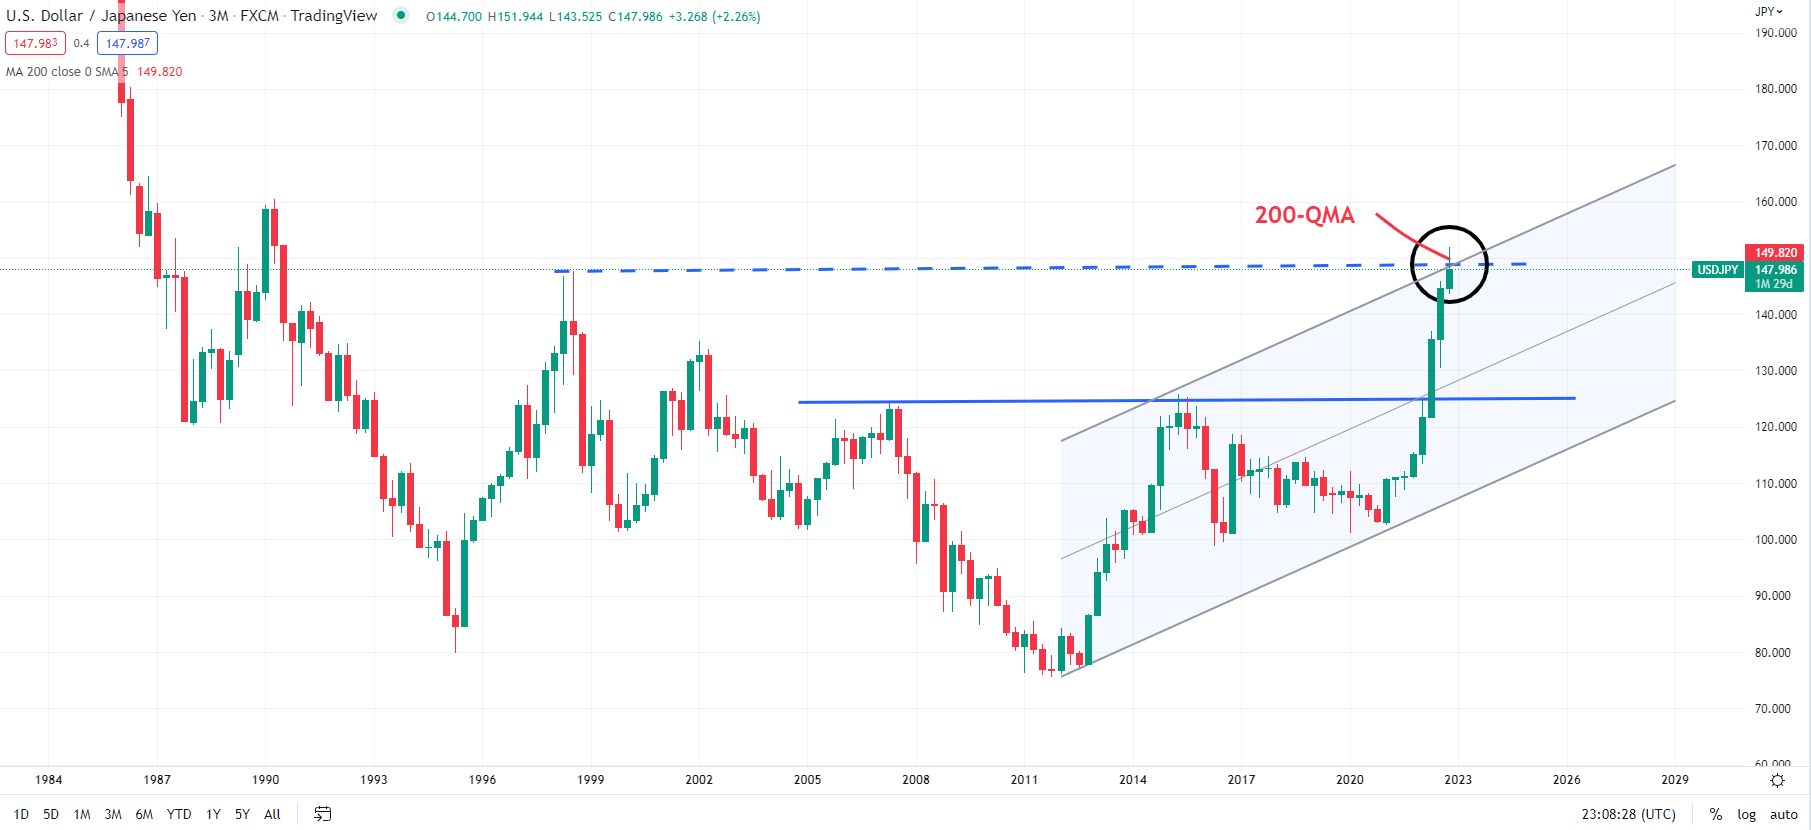
Chart Created Using TradingView
Furthermore, back-to-back long-legged candles on the weekly charts at the October highs reflect indecision at major resistance, especially given the context of the sharp gains in recent months. Greater conviction – that is, big candles with small wicks or none at all – tends to increase the probability of a resistance break. However, small candle bodies with long wicks telegraph reduced chances of an imminent break of resistance, as they tend to reflect a lack of confidence. This is further reinforced by negative divergence on the daily and weekly charts (rising price associated with stalling or declining momentum). That may speak to rally fatigue.
The focus is now on immediate support at the September highs of 145-146. A decisive break below this barrier would confirm that the short-term upward pressure had faded, raising the prospect of some consolidation or a minor retreat. Any further downward pressure could open the way toward the September intervention low of 140.35 near the 89-day moving average (DMA) and the July high. As the chart below shows, the last time USD/JPY was decisively below the average was in early 2021 before the surge began.
USD/JPY Daily Chart
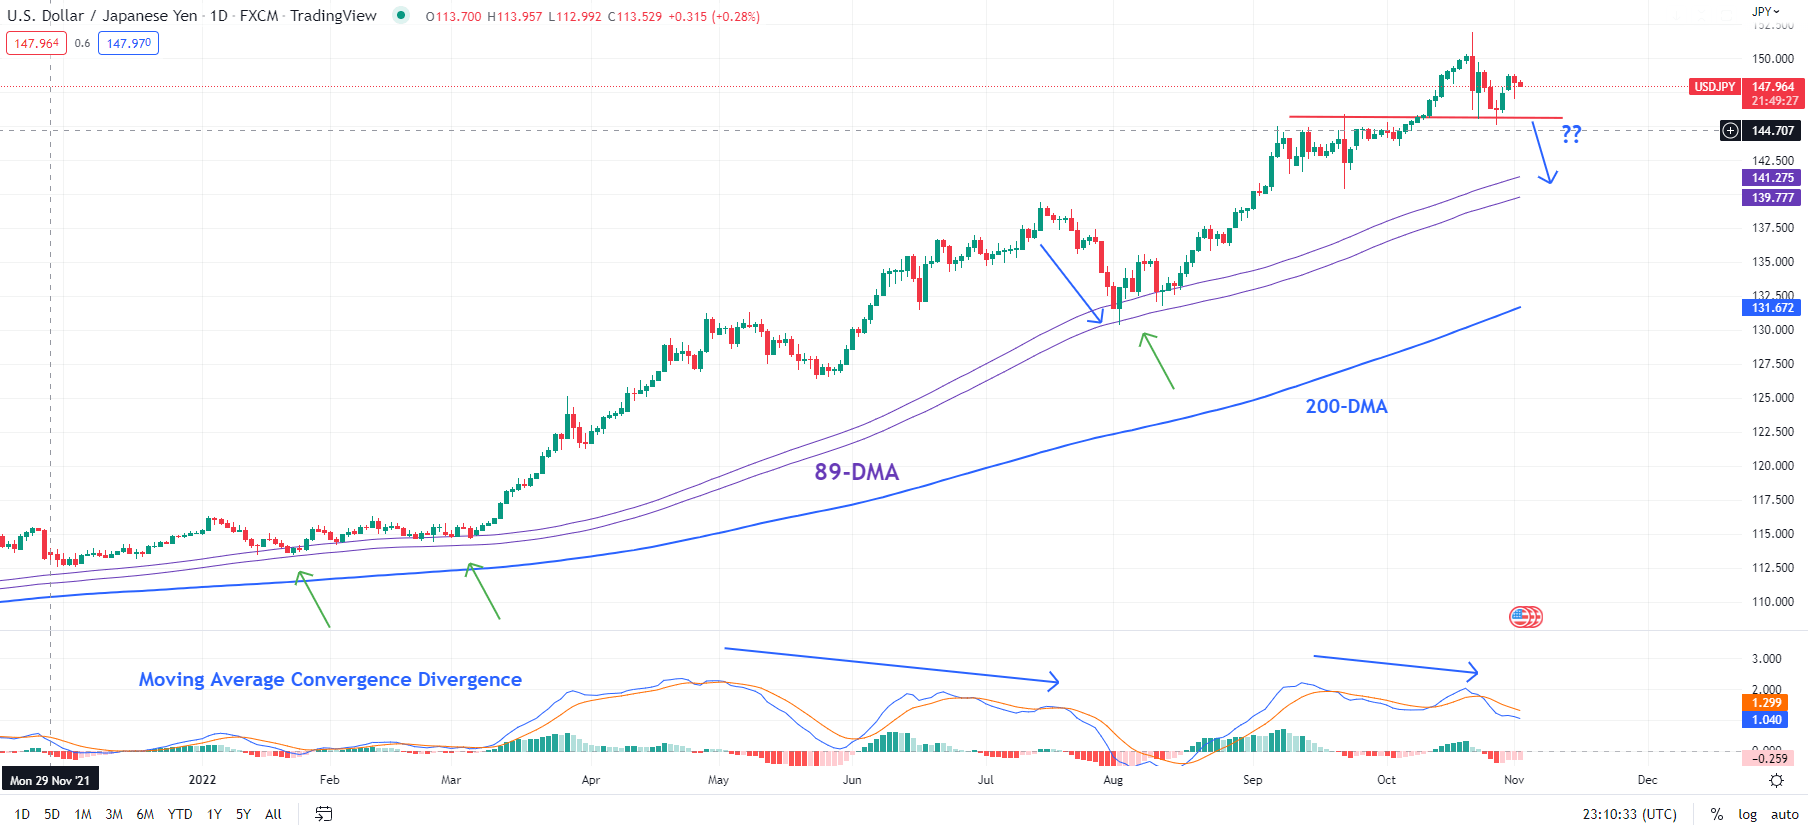
Chart Created Using TradingView
Zooming out, any potential setback could be viewed as a correction within an overall uptrend. The upward momentum on longer-term charts, including monthly and quarterly, remains strong, and any retreat could be short-lived. In this regard, a key signpost would be the 89-DMA – USD/JPY would need to break below this threshold for an extended drop toward the 200-day moving average (now at 131.50).
--- Written by Manish Jaradi, Strategist for DailyFX.com


