


S&P 500 - TECHNICAL OUTLOOK:
- The S&P 500 has broken above key resistance.
- The break implies that the short-term trend remains up.
- What is the outlook and what are the signposts to watch?

S&P 500 TECHNICAL OUTLOOK – NEUTRAL
Thursday’s jump in the S&P 500 index confirms that the short-term trend remains up. The index hit a new two-month high, keeping the higher-highs-higher-lows pattern remains intact. This is a reassertion that the month-long uptrend has not changed.
The sharpest rally in two years negated a potential crack in the rise that developed earlier this week after the index posted a lower high. However, as this column noted yesterday, the US benchmark index continues to hold within a rising channel and – on its own – a lower peak wouldn’t necessarily imply bearishness. Prices rebounded from near quite-strong support on the lower edge of the channel, coinciding with the 200-hour moving average.
S&P 500 Hourly Chart
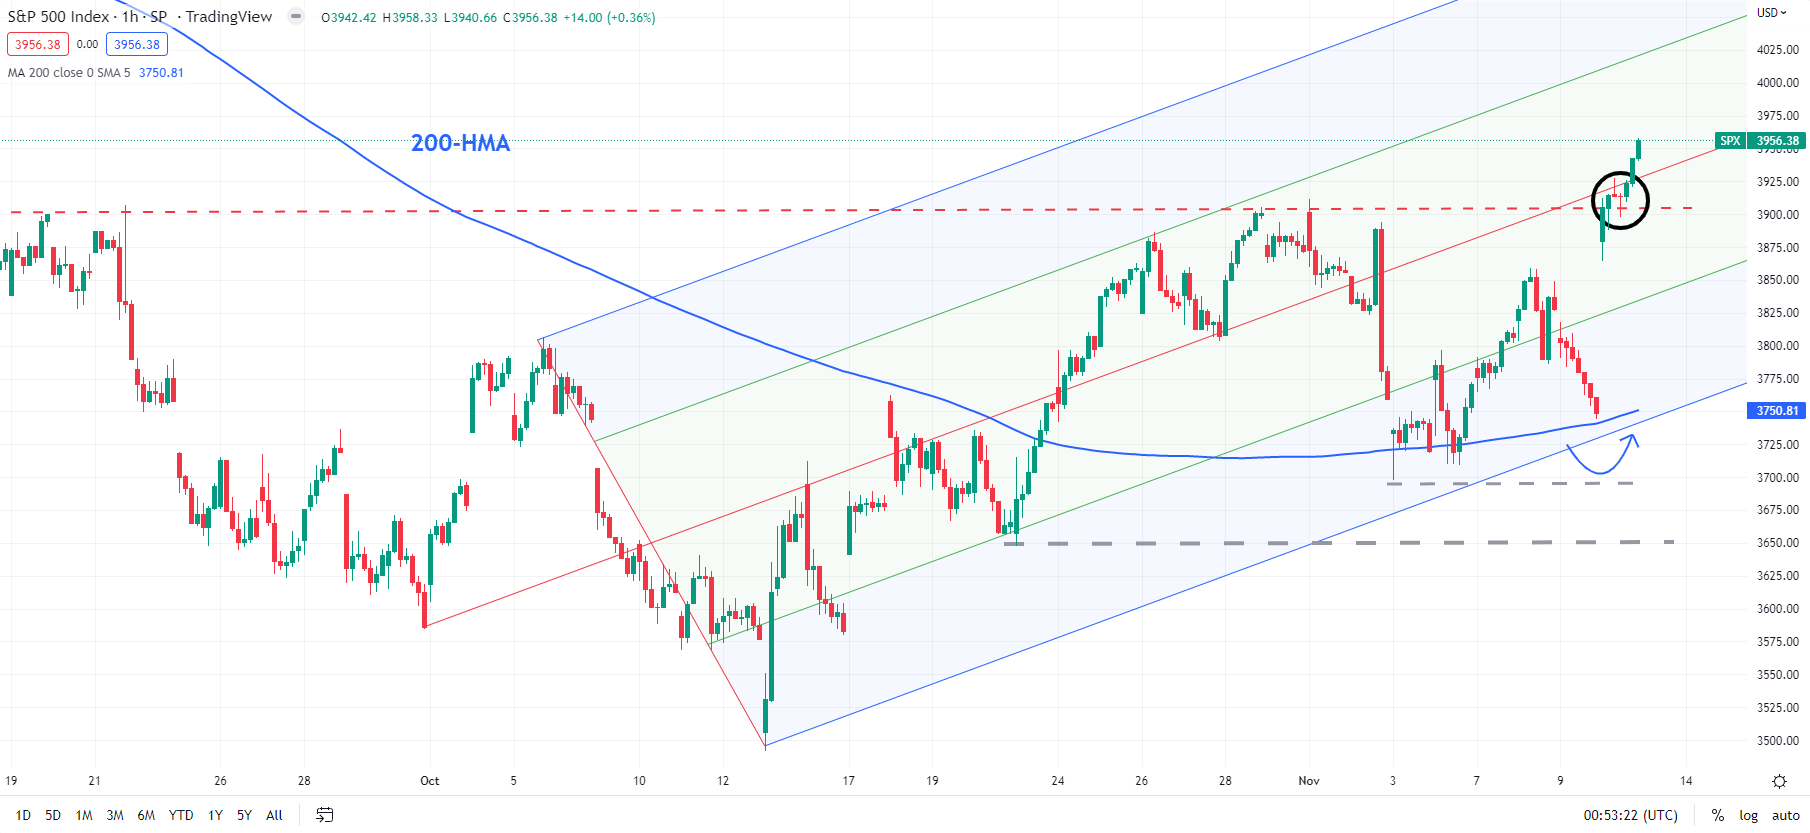
Chart Created Using TradingView
The S&P 500 index has broken above key resistance at the early-November high of 3912, opening the way toward the 200-day moving average (now at 4083). This hurdle will be tough to cross, at least in the first attempt. That’s because corrective rallies this year have terminated around converged moving average resistance: the 89-day moving average and the 200-day moving average (see chart). For now, the short-term trend remains up.

S&P 500 Daily Chart
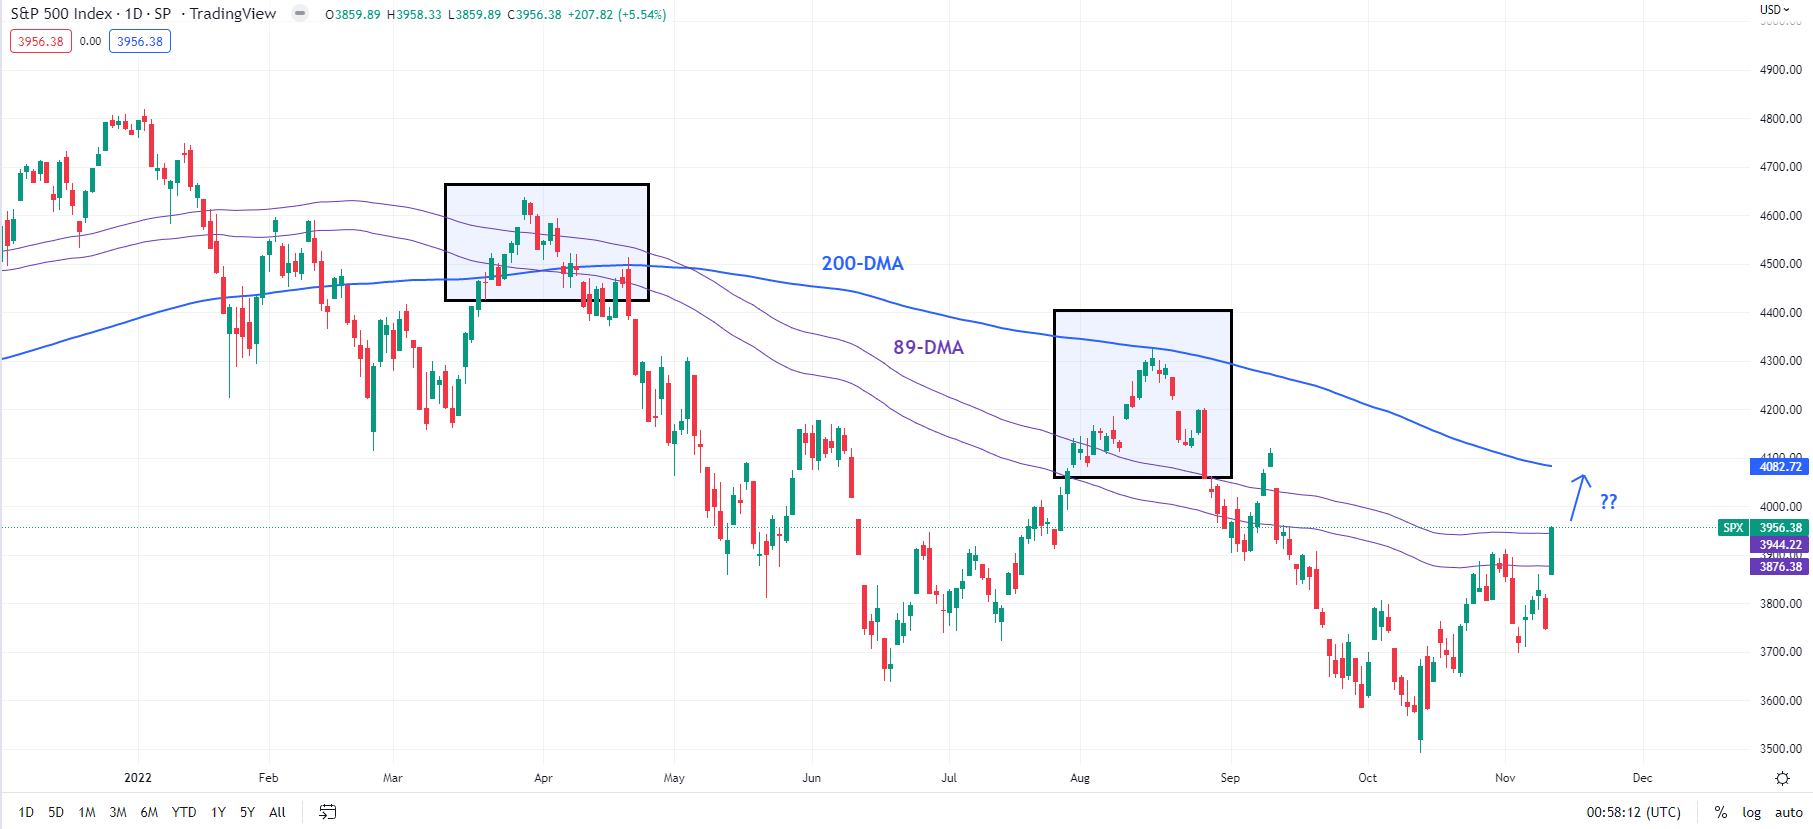
Chart Created Using TradingView
Beyond the immediate term, momentum on longer-term charts hasn’t turned up yet. A sustained rebound could correct some of the weakness on higher timeframe charts. For this, the index needs to break a series of resistance levels, that is, keeping the higher-highs-higher-lows pattern in place. In this regard, a break above the 200-day moving average could be the first sign that medium-term bearishness is reversing. Subsequent resistance is at the August high of 4325.
On the downside, the index needs to hold above key support at the early-November low of 3698 if the month-long uptrend must hold.

--- Written by Manish Jaradi, Strategist for DailyFX.com


