


Natural Gas, Moving Averages – Technical Update:
- Natural gas prices setting up for worst week since late January
- On the daily, the commodity is back to testing the 20-day SMA
- Bearish Rising Wedge breakout remains in focus on the 4-hour
Trade Smarter - Sign up for the DailyFX Newsletter
Receive timely and compelling market commentary from the DailyFX team
Daily Chart – Prices Testing the 20-day SMA
So far this week, natural gas priceds have declined over 15 percent. The heating commodity seems to be setting up for the worst 5-day performance since the end of January. The leg higher which occurred towards the end of February followed persistent positive RSI divergence, showing that downside momentum was fading.
However, while natural gas was able to push above the 20-day Simple Moving Average (SMA), the 50-day line is yet to be tested. Broadly speaking, the bearish Death Cross between these 2 SMAs since December remains in focus. The falling trendline from August is also maintaining the downside bias. Now, prices are back to testing the 20-day SMA.
A breakout lower could open the door to revisiting the February low at 2.52 towards the 2020 low at 1.44. Otherwise, immediate resistance is the 50-day SMA followed by the 23.6% Fibonacci retracement level at 3.297.
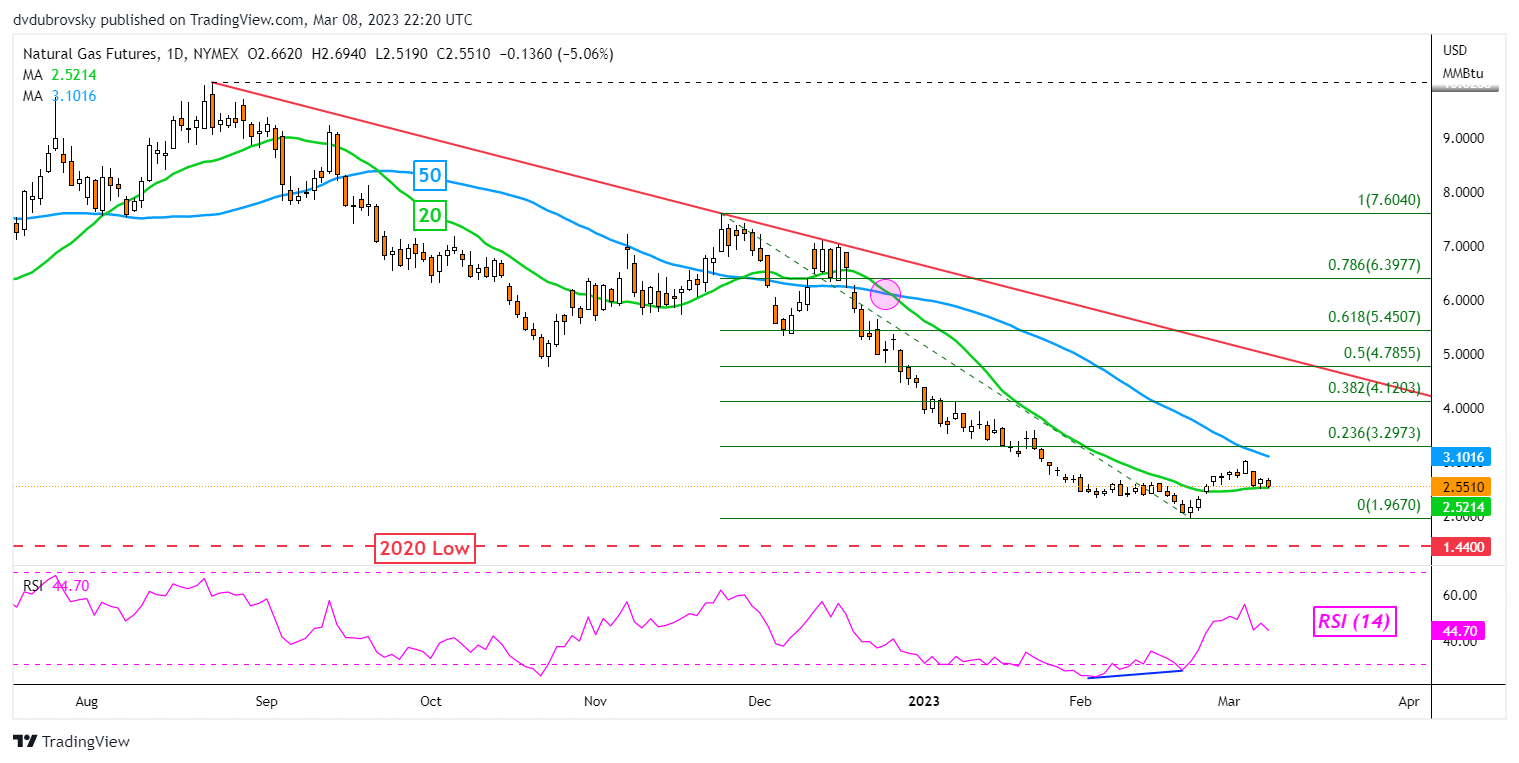
Chart Created Using TradingView
4-Hour Chart – Eyes on the 100-Period SMA
Zooming in on the 4-hour setting can help paint a clearer picture of the near-term directional setup. Prices have confirmed a breakout under a bearish Rising Wedge chart formation, opening the door to resuming the prior downtrend. Now, prices are facing the next key technical test – the 100-period SMA. The latter is holding as key support, as well as the midpoint of the Fibonacci retracement at 2.498.
Confirming a breakout lower opens the door to extending losses, placing the focus on the 61.8% and 78.6% levels at 2.373 and 2.195, respectively. Not long afterward, the February low will come into play. In the event of a turn higher, the 38.2% level seems to be immediate resistance at 2.622 followed by the 23.6% point at 2.777.

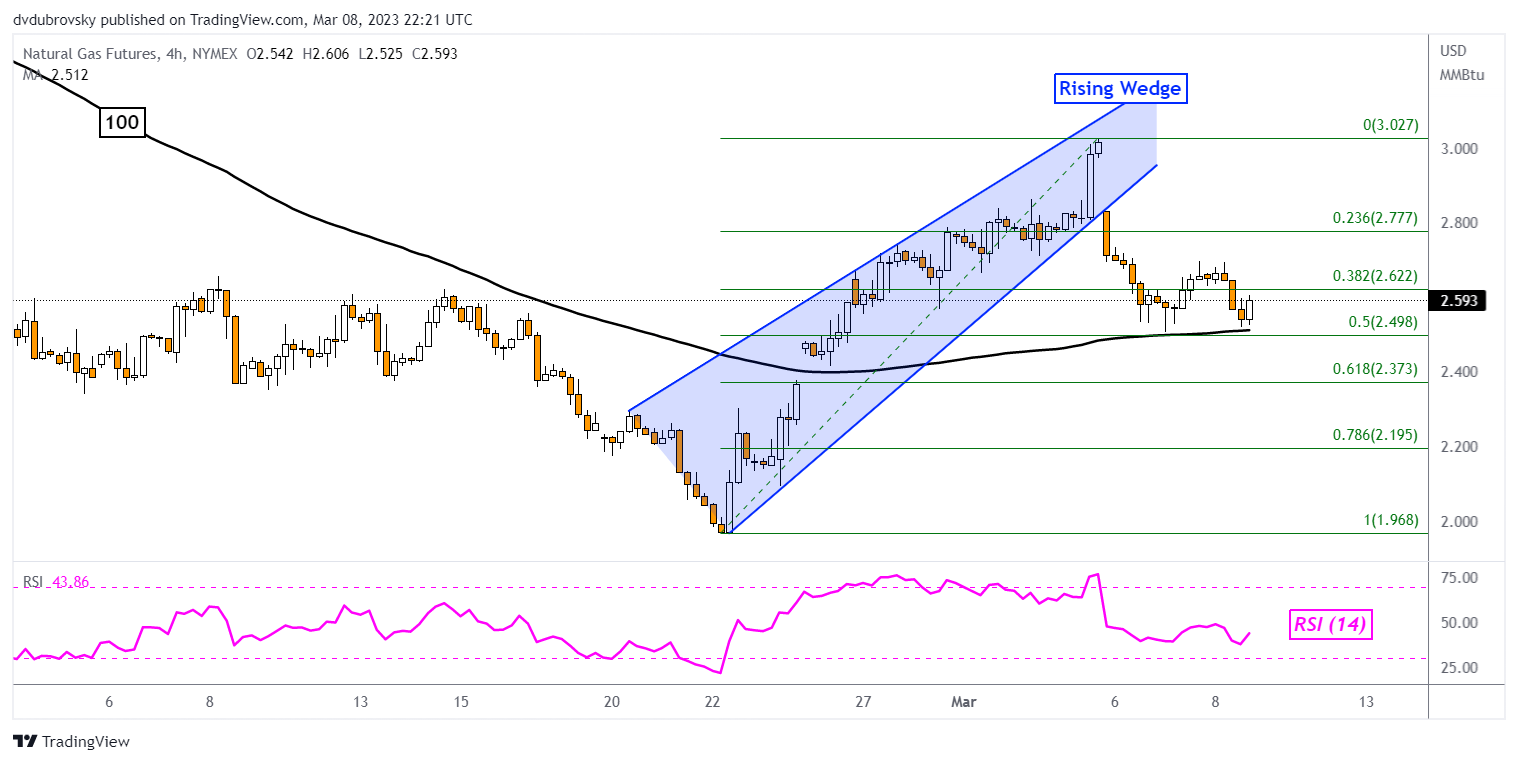
Chart Created Using TradingView
--- Written by Daniel Dubrovsky, Senior Strategist for DailyFX.com
To contact Daniel, follow him on Twitter:@ddubrovskyFX


