


Natural Gas, Rising Wedge Breakout – Technical Update:
- Natural gas prices abruptly reverse lower on milder US weather outlook
- Monday’s 14.52 percent drop was the worst going back to June of 2022
- A bearish Rising Wedge breakout is now in play on the 4-hour timeframe
Trade Smarter - Sign up for the DailyFX Newsletter
Receive timely and compelling market commentary from the DailyFX team
Daily Chart – Worst Day Since June 2022
Natural gas prices abruptly turned lower on Monday after completing the best week since July. The 14.52% drop represented the worst 24-hour period since June 2022. From a fundamental standpoint, the weather was a key driver for the heating commodity. According to Bloomberg, US weather estimates shifted milder over the weekend. That would likely open the door to less demand amid still-elevated inventory levels.
Focusing on the daily chart below, natural gas is back to the 20-day Simple Moving Average (SMA). The latter is immediate support. A confirmatory breakout lower could open the door to revisiting the February low at 1.967. Beyond the latter is the 2020 bottom at 1.44. Meanwhile, immediate resistance is a combination of the 50-day SMA and the 23.6% Fibonacci retracement level at 3.297.
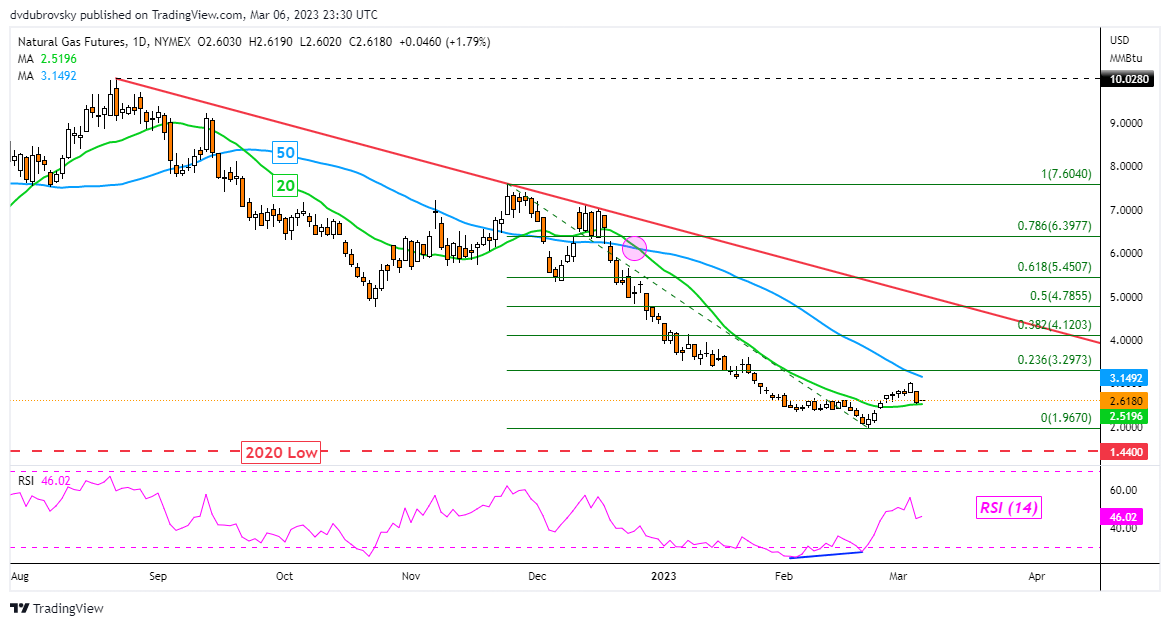
Chart Created Using TradingView
4-Hour Chart – Rising Wedge Breakout in Focus
Things are starting to look bearish again in the near-term 4-hour timeframe. Since the end of February, I have been highlighting a bearish Rising Wedge chart formation that has been brewing. Overnight, natural gas has confirmed a breakout under this pattern. This is opening the door to resuming the downtrend that occurred from the end of December to the end of February.
Immediate support is a combination of the 100-period SMA as well as the midpoint of the Fibonacci retracement level at 2.498. Clearing these technical obstacles exposes the 61.8% and 78.6% levels at 2.373 and 2.195, respectively. On the other hand, immediate resistance is at the 38.2% level at 2.622 before the 23.6% point at 2.777 comes into focus.

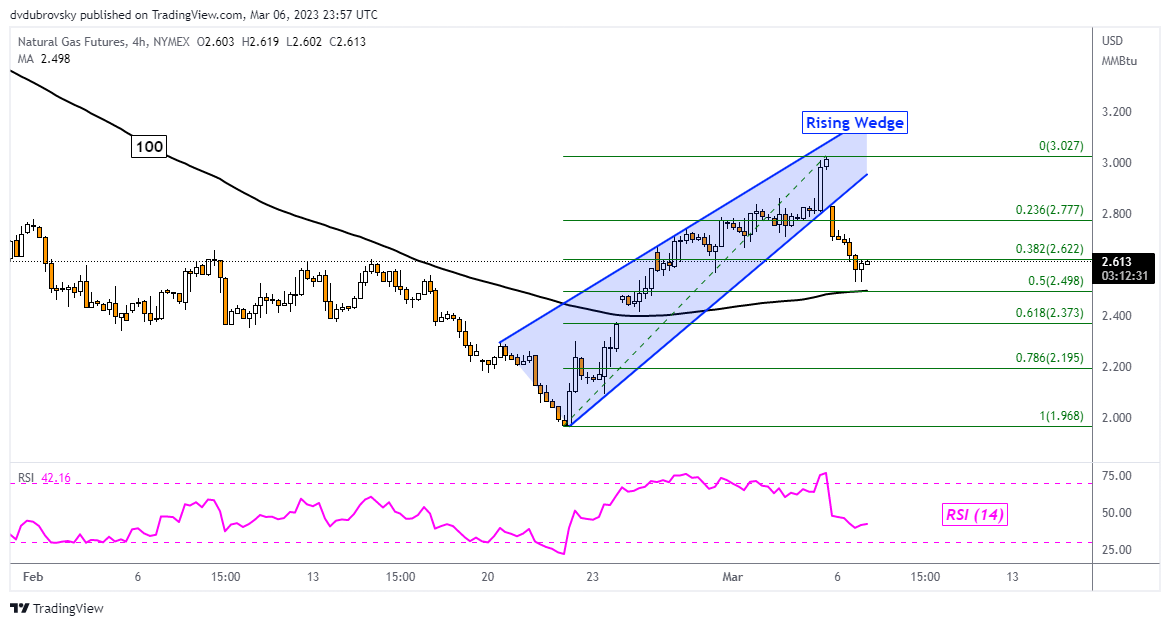
Chart Created Using TradingView
--- Written by Daniel Dubrovsky, Senior Strategist for DailyFX.com
To contact Daniel, follow him on Twitter:@ddubrovskyFX


