


Natural Gas, NG - Technical Outlook:
- A major double top pattern points to further downside in natural gas.
- No sign of reversal so far amid a milder Northern Hemisphere winter.
- To what extent can natural gas prices fall?

NATURAL GAS TECHNICAL OUTLOOK - BEARISH
Developments on technical charts suggest natural gas prices could fall further amid forecasts for warmer-than-normal weather through mid-February.
Reports suggest meteorologists forecast temperatures across much of the lower U.S. Lower 48 states would remain below normal through Feb. 4 before rising to mostly above-normal levels through Feb. 17, raising concerns about reduced demand for gas for heating through the middle of the month.
Natural Gas Weekly Chart
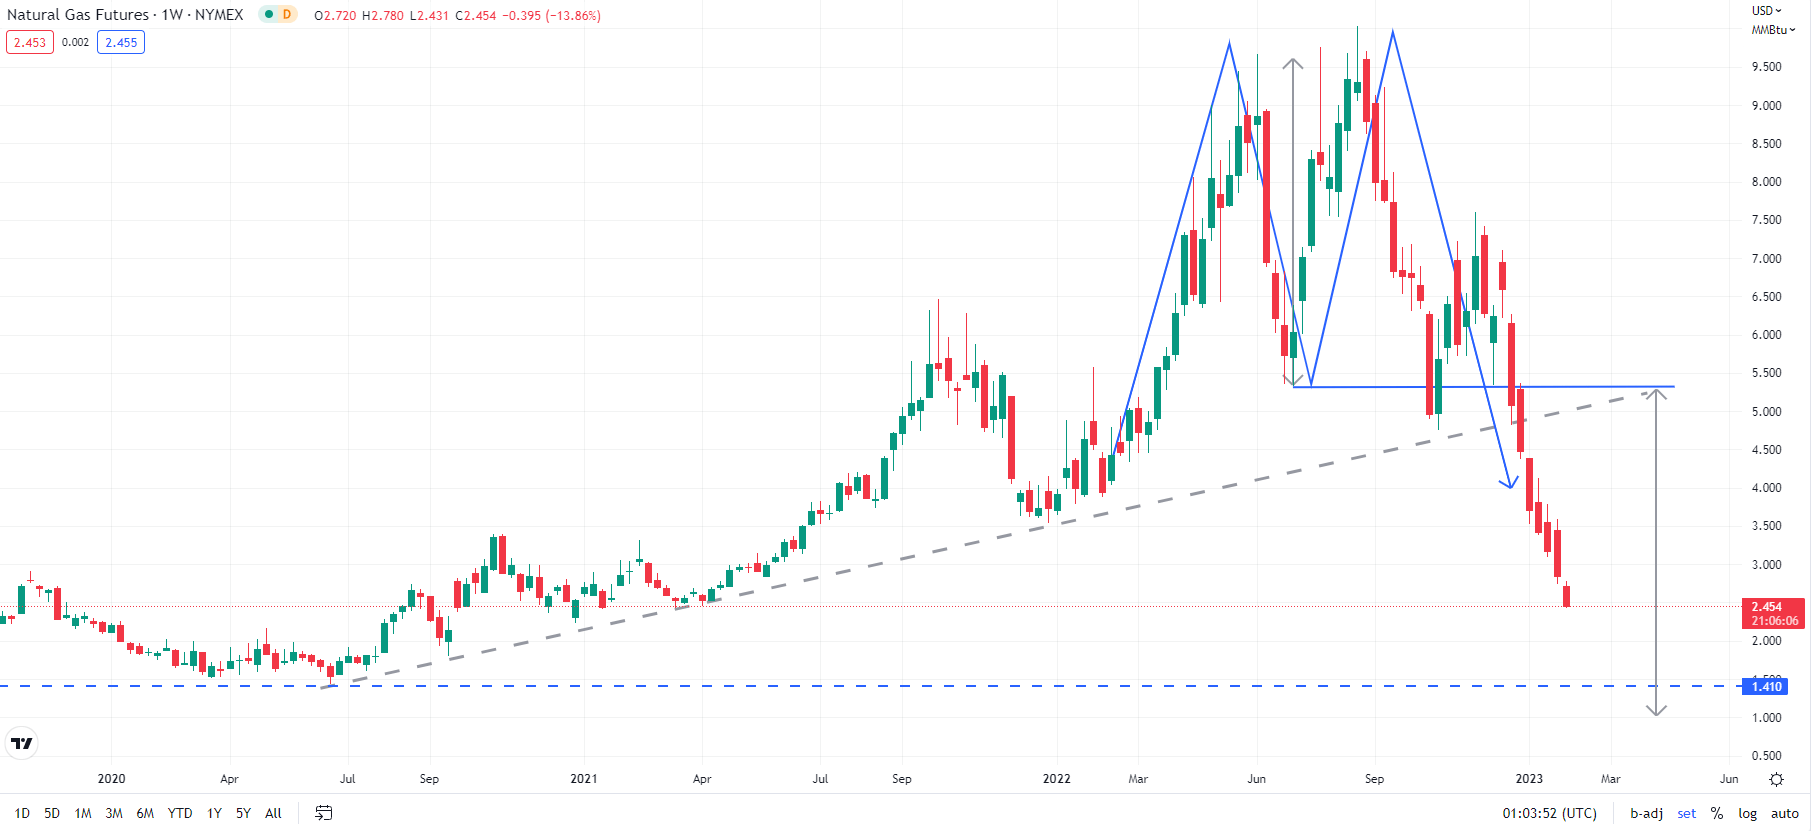
Chart Created Using TradingView
In Europe, a milder-than-expected winter so far has meant that higher gas storage levels at the end of last year haven’t been adequately utilized. At the end of January, reports suggest storage was about 72% full, well above the five-year average of 54% for this time of the year. Moreover, Chinese LNG demand last year dropped significantly, creating further headwinds.
Natural Gas Monthly Chart
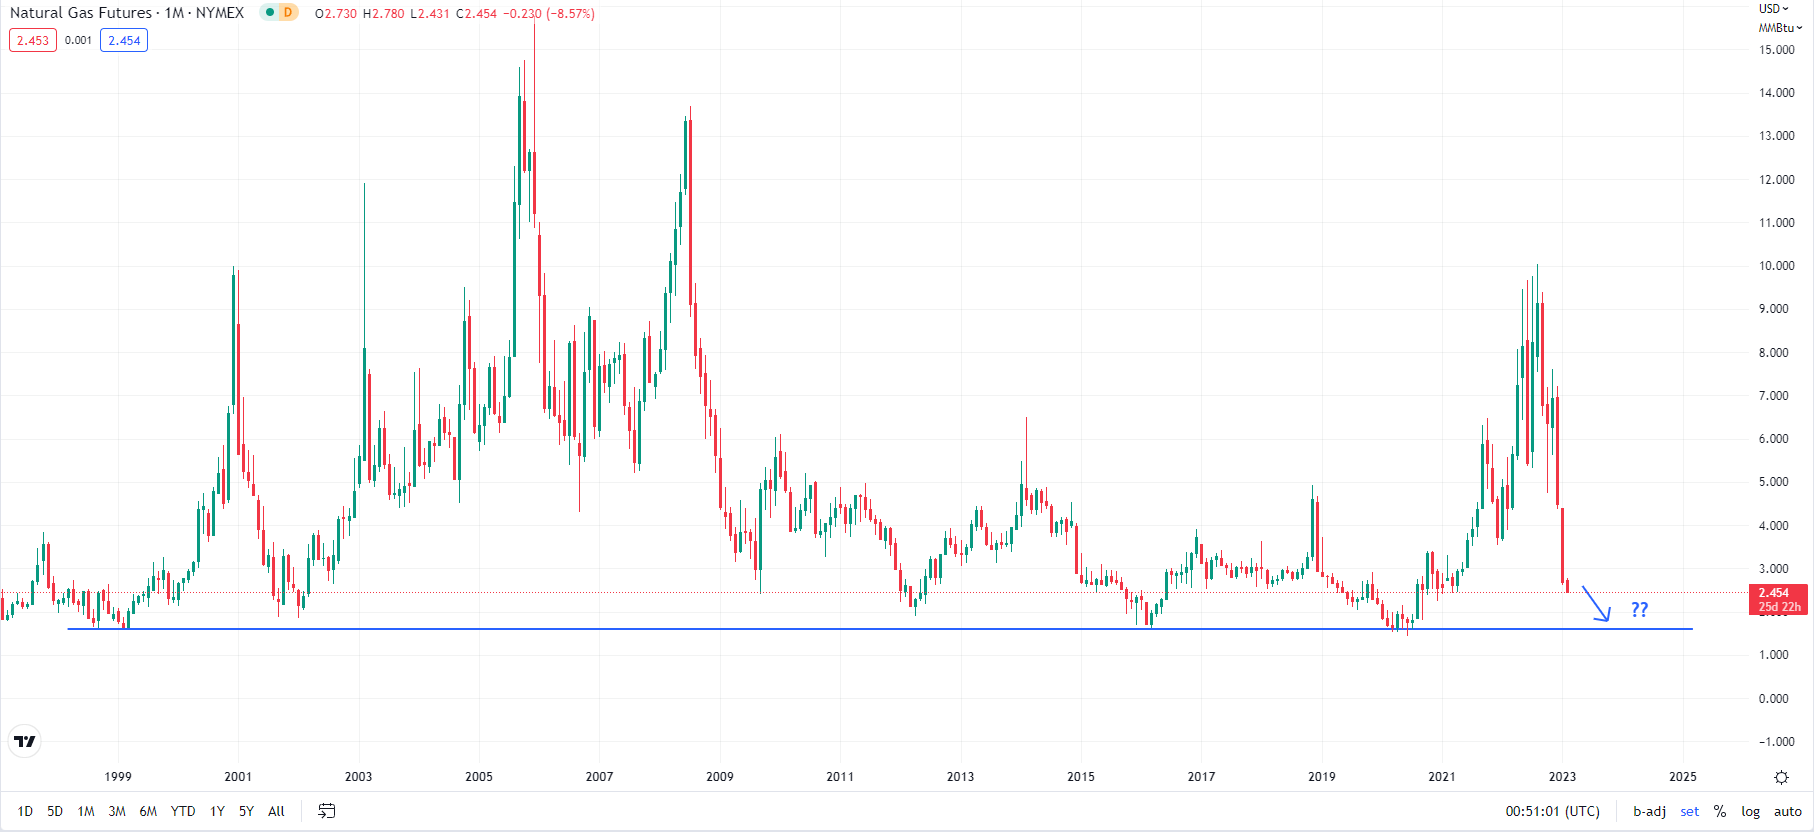
Chart Created Using TradingView
On technical charts, a major double-top pattern (the 2022 highs) triggered at the end of last year points to further downside in natural gas, potentially toward the 2020 low of around 1.45 (see weekly chart). The bearish break was also associated with a fall below a key uptrend line from 2020, confirming that the medium-term uptrend has broken down.
Immediate support is at the end-2020 low of 2.25. However, strong downward momentum on the daily and the weekly charts raises the odds of a fall below 2.25, toward a horizontal trendline from 1999, at about 1.45-1.50. On the upside, the 12-day moving average has provided a stiff hurdle since December. The average currently stands at about 2.90. Stronger resistance is at the January 24 high of 3.60.

--- Written by Manish Jaradi, Strategist for DailyFX.com


