


Natural Gas, RSI Divergence, Falling Wedge – Technical Update:
- Natural gas prices continue aiming lower in recent weeks
- But, downside momentum has been fading, reversal next?
- Falling Wedge still remains the focus on the 4-hour frame
Trade Smarter - Sign up for the DailyFX Newsletter
Receive timely and compelling market commentary from the DailyFX team
Weekly Chart – Is Momentum Fading?
Natural gas prices extended lower this past week, marking a 3rd consecutive losing streak. This is not something out of the ordinary for the heating commodity as of late, with consistent losses occurring since the summer of 2022. But a closer look reveals that positive RSI divergence is starting to emerge in this timeframe. As in, prices are looking at setting new lows, but the indicator is not. This is a sign of fading downside momentum, which can at times precede a turn higher. Let us take a closer look.
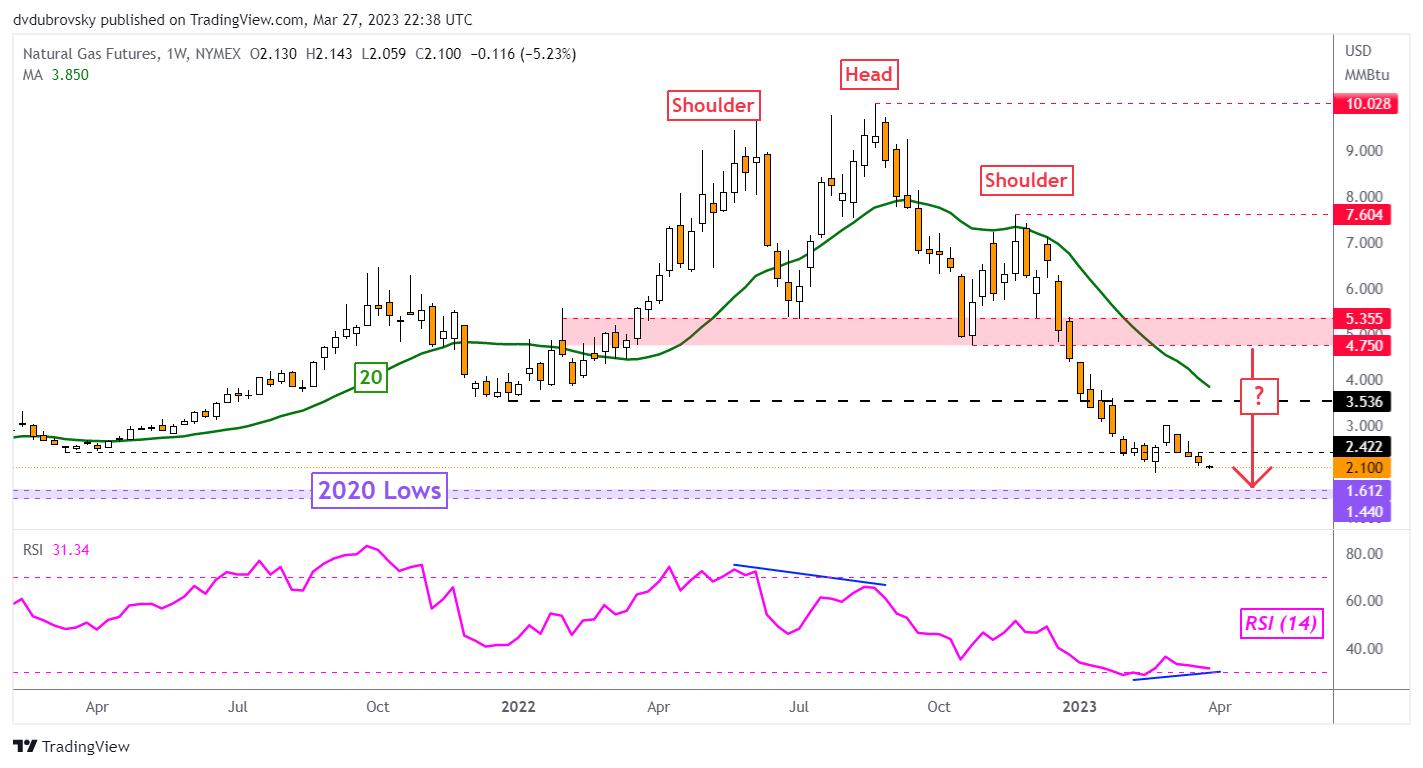
Chart Created Using TradingView
Daily Chart – Eyes on the February Low
On the daily chart, prices are sitting just above the February low at 1.967. This price also represents the current 2023 low, as well as the weakest point since September 2020. Much like with the weekly setting, this timeframe also displays positive RSI divergence.
In the event of a turn higher, the 50-day Simple Moving Average (SMA) could hold as immediate resistance, maintaining the downside focus. Otherwise, extending gains places the focus on the March 3rd high at 3.027. Meanwhile, breaking under support exposes the 23.6% Fibonacci extension at 1.696 toward the 2020 bottom at 1.44.
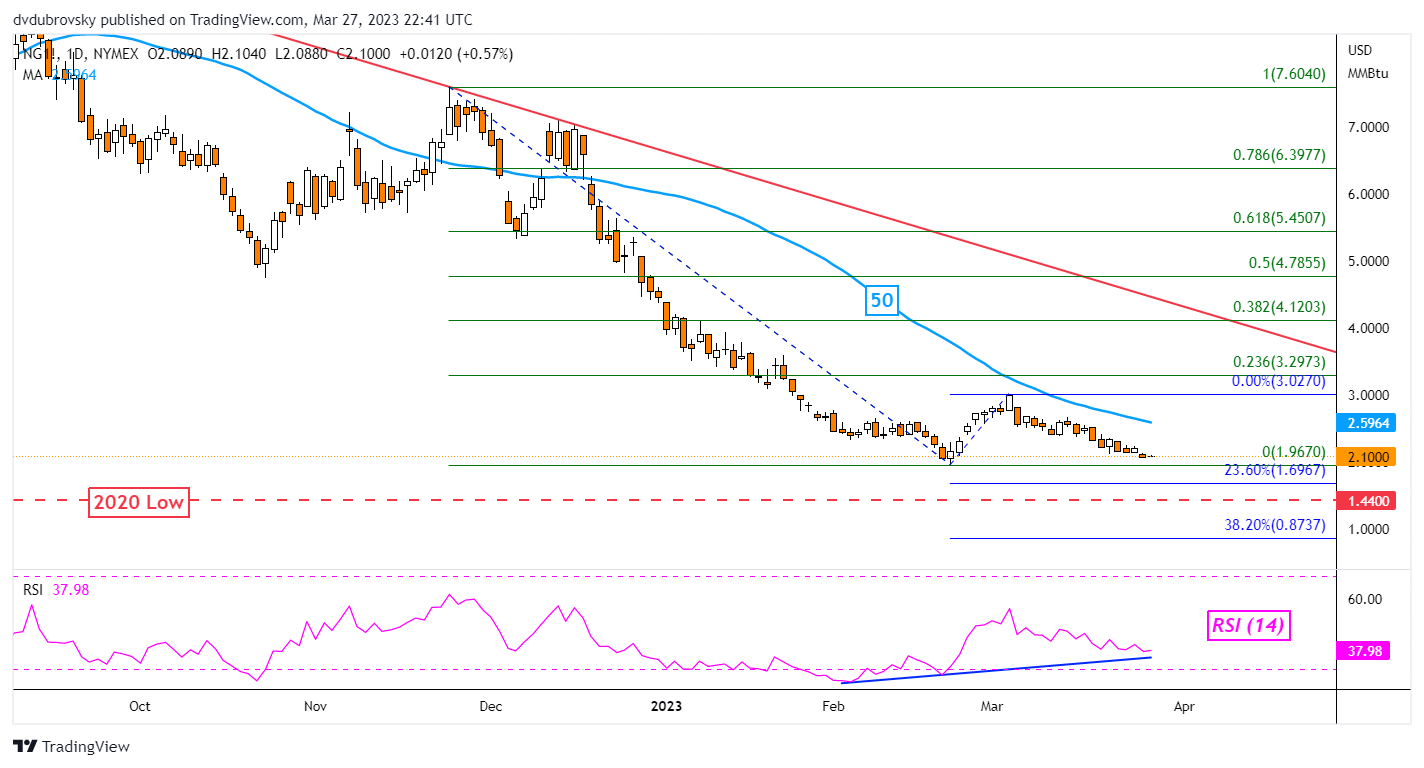
Chart Created Using TradingView
4-Hour Chart – Falling Wedge Continues Growing
Zooming in further on the 4-hour view, the Falling Wedge outlined earlier this month continues brewing. So long as natural gas remains within the confines of this pattern, the near-term outlook remains bearish. But, an upside breakout would open the door to a bullish reversal. That would place the focus on the 100-period SMA, which may hold as resistance.
{{FUNDAMENTALS BREAKOUT TRADING}}
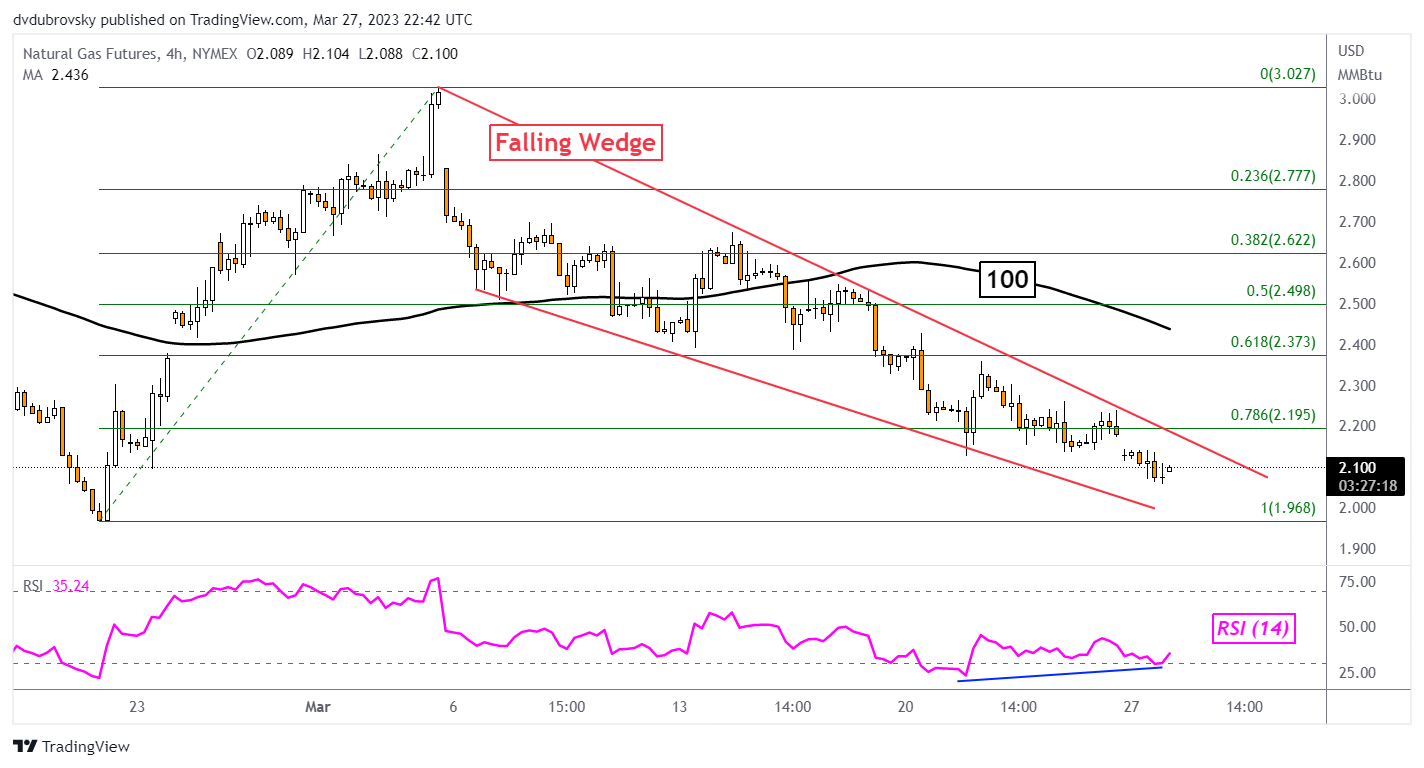
Chart Created Using TradingView
--- Written by Daniel Dubrovsky, Senior Strategist for DailyFX.com
To contact Daniel, follow him on Twitter:@ddubrovskyFX


