


Natural Gas, Falling Wedge – Technical Update:
- Natural gas prices struggling to clear key support
- 4-hour chart shows that a Falling Wedge is brewing
- Still, the broader downside technical bias holds
Trade Smarter - Sign up for the DailyFX Newsletter
Receive timely and compelling market commentary from the DailyFX team
Daily Chart – Support Holding Up
Natural gas prices have been aiming steadily lower in recent weeks. This continues to follow the trajectory of a bearish Head & Shoulders chart formation noted on the weekly chart. However, recent price action has been rather slow and steady as support has been reinforced. This seems to be around 2.341, an inflection point established back in February.
This is holding as immediate support. Breaking lower exposes the February low at 1.967. Beyond the latter sits the bottom from 2020 at 1.44. A meaningful push higher would likely entail clearing past the 50-day Simple Moving Average (SMA) as well as the March 3rd high at 3.027. The broader technical outlook remains bearish, with the falling trendline from August maintaining the dominant downside focus.
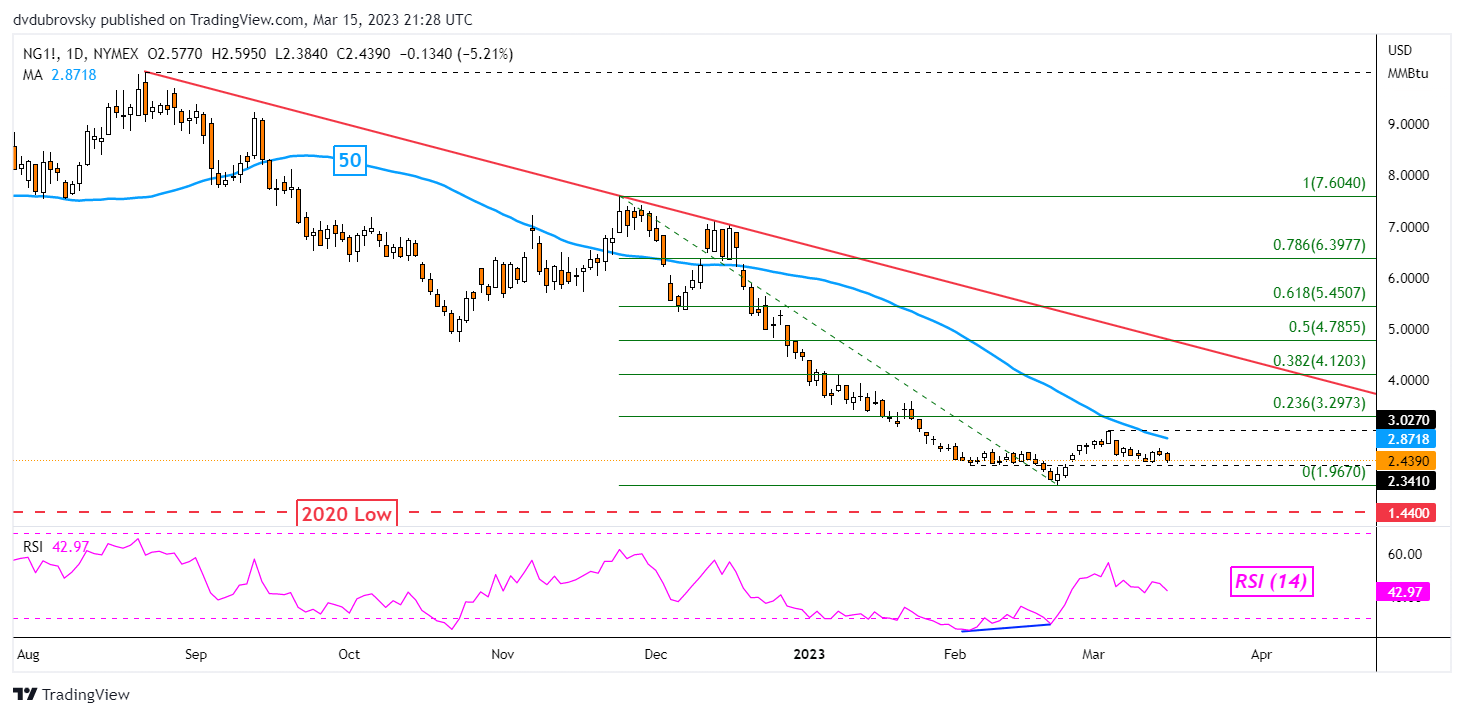
Chart Created Using TradingView
4-Hour Chart – Falling Wedge
Looking at the 4-hour setting will help paint a clearer picture of the near-term outlook. Natural gas prices have been trading lower within the boundaries of a bullish Falling Wedge chart formation. This followed a confirmatory breakout under the 50-period SMA. While prices remain in the formation, the immediate technical bias points to a slight downward setting.
However, a confirmatory push above the Falling Wedge could open the door to an increasingly bullish technical bias. That would entail closing above the 38.2% Fibonacci retracement level at 2.622. That exposes the 23.6% level at 2.777 before the early March high comes into play. Otherwise, extending lower has immediate support at the 61.8% level at 2.373.

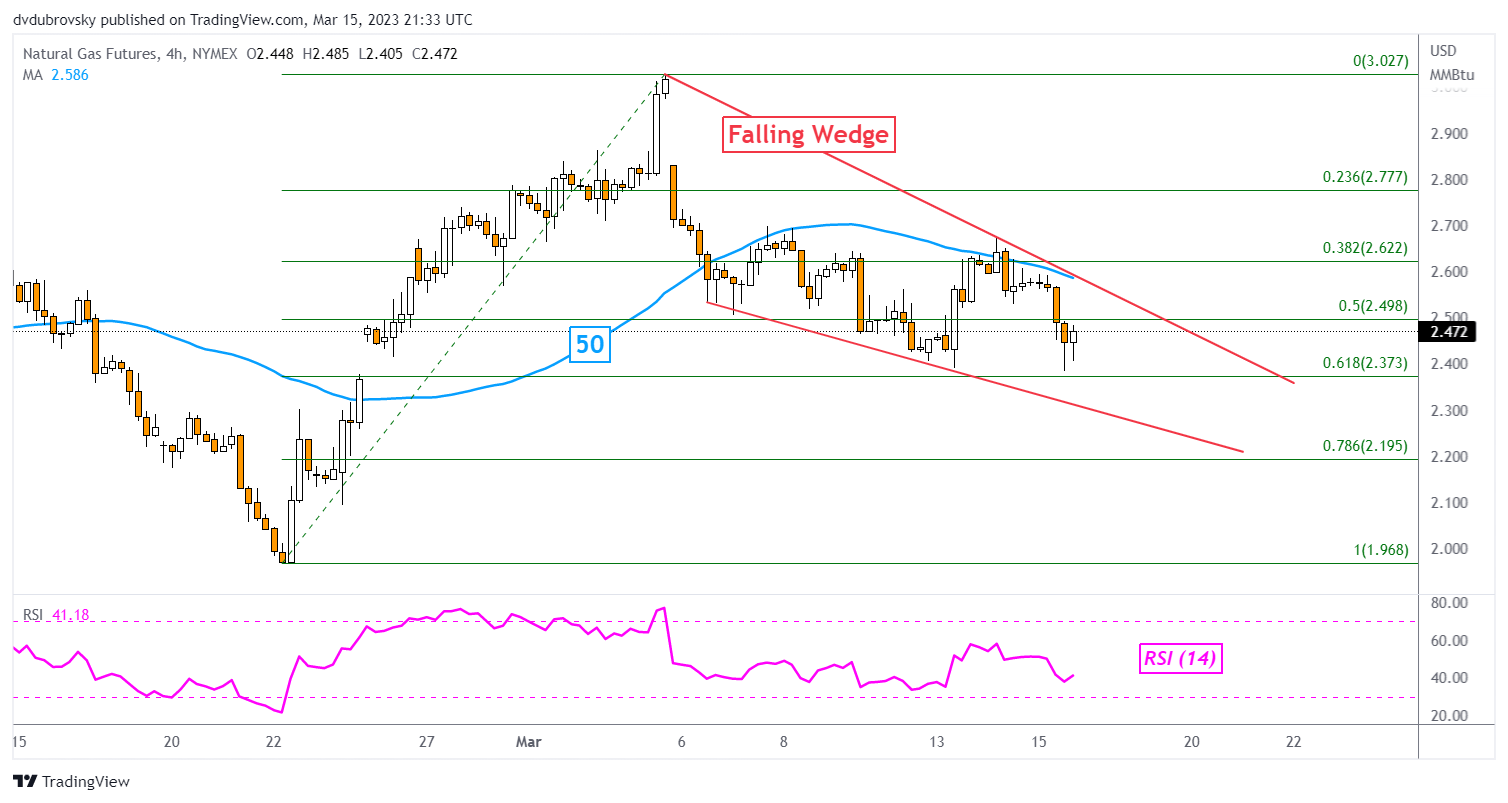
Chart Created Using TradingView
--- Written by Daniel Dubrovsky, Senior Strategist for DailyFX.com
To contact Daniel, follow him on Twitter:@ddubrovskyFX


