


Natural Gas, Head & Shoulders, Doji – Technical Outlook:
- Natural gas futures sank for a fifth consecutive week
- Bearish Head & Shoulders continues to hint at pain
- Daily chart shows early sign of hesitation, where to?
Trade Smarter - Sign up for the DailyFX Newsletter
Receive timely and compelling market commentary from the DailyFX team
Weekly Chart – Fifth Consecutive Week of Losses Underscores Downtrend
Natural gas futures fell 7.17% this past week, in line with a recent string of losses since the middle of December. The commodity declined for a fifth consecutive week, marking the longest losing streak since the middle of September. What is the road ahead looking like for natural gas this week?
From a technical standpoint, there was a notable confirmatory downside breakout under the December 2021 low at 3.536. That has opened the door to resuming the dominant downtrend since August 2022, exposing the 2020 low at 1.44.
Moreover, prices continue trading downward in the direction anticipated by a Bearish Head and Shoulders chart formation. The estimated trajectory of this chart formation may eventually take prices down to the 1.44 – 1.61 support zone.
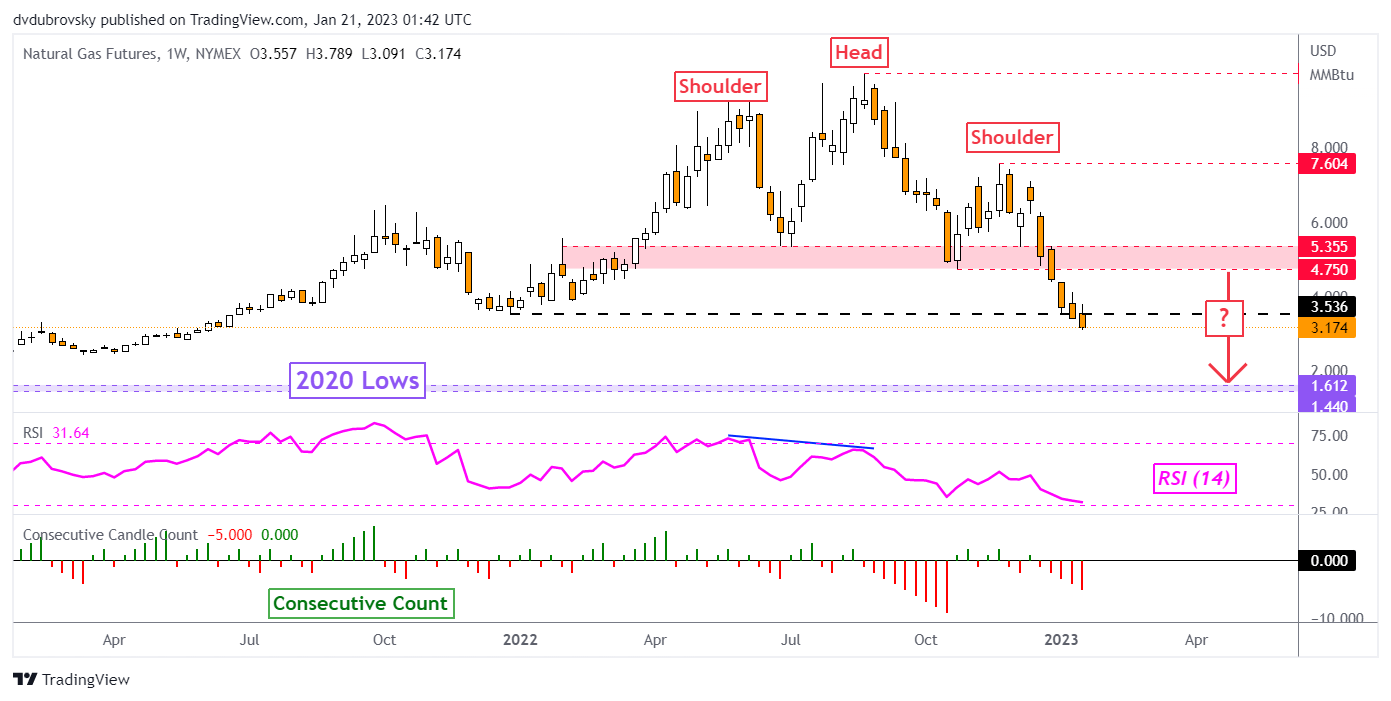
Chart Created Using TradingView
Daily Chart – Inverted Hammer in Focus
On the daily setting, prices confirmed a breakout under 3.5536, bringing natural gas towards the May 2021 inflection point at 3.15. However, prices were unable to close under the latter last week, reinforcing it as immediate support.
An Inverted Hammer candlestick pattern was left behind as well. While this is not necessarily an early indication of a reversal, it would be worth paying attention to see if prices bounce in the coming session. That would confirm the Inverted Hammer.
Such an outcome would place the focus on the 20-day Simple Moving Average (SMA). It could hold as key resistance, maintaining the downside focus. Otherwise, confirming a breakout under 3.15 exposes the 100% Fibonacci extension level at 2.326 towards the 2020 low.

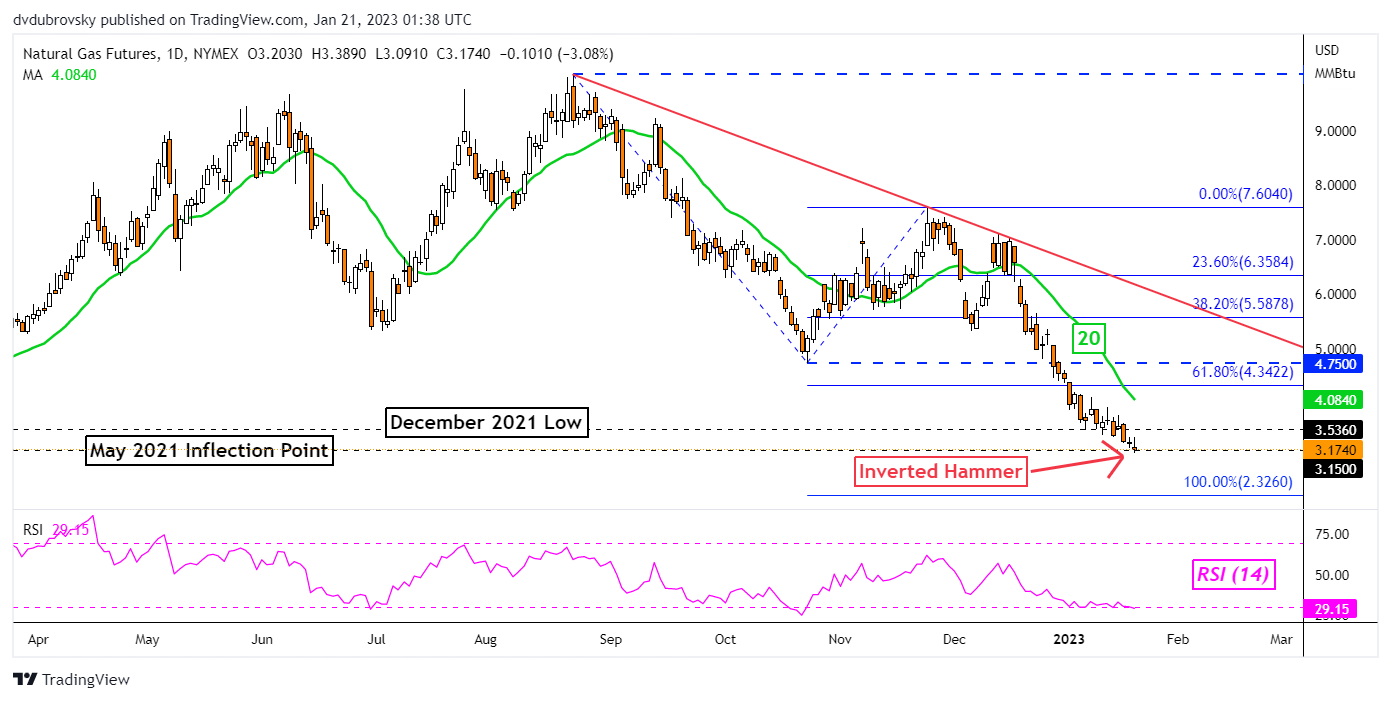
Chart Created Using TradingView
--- Written by Daniel Dubrovsky, Senior Strategist for DailyFX.com
To contact Daniel, follow him on Twitter:@ddubrovskyFX


