


Natural Gas, Dojis, Bullish Engulfing – Technical Update:
- Natural gas prices idled on Tuesday, prices remain lower though
- Another Doji emerged on the daily chart, showing more indecision
- 4-hour chart reveals a Bullish Engulfing and fading momentum
Trade Smarter - Sign up for the DailyFX Newsletter
Receive timely and compelling market commentary from the DailyFX team
Daily Chart – 20-Day Simple Moving Average Catching Up
Natural gas prices finished little changed on Tuesday, although prices remain lower for this week so far. Another Doji candlestick pattern emerged over the past 24 hours after an identical one formed on Monday. The Doji itself is not necessarily a sign of an imminent reversal. Rather, it paints indecision, especially when it occurs within trending markets.
Follow-through remains important to watch over the remaining 24 hours. Downside momentum is slowing as of late. This is bringing the 20-day Simple Moving Average (SMA) closer into focus. The latter may hold as resistance in the event of a turn higher, maintaining the downside focus. Otherwise, extending losses place the focus on the 100% Fibonacci extension level at 2.326.
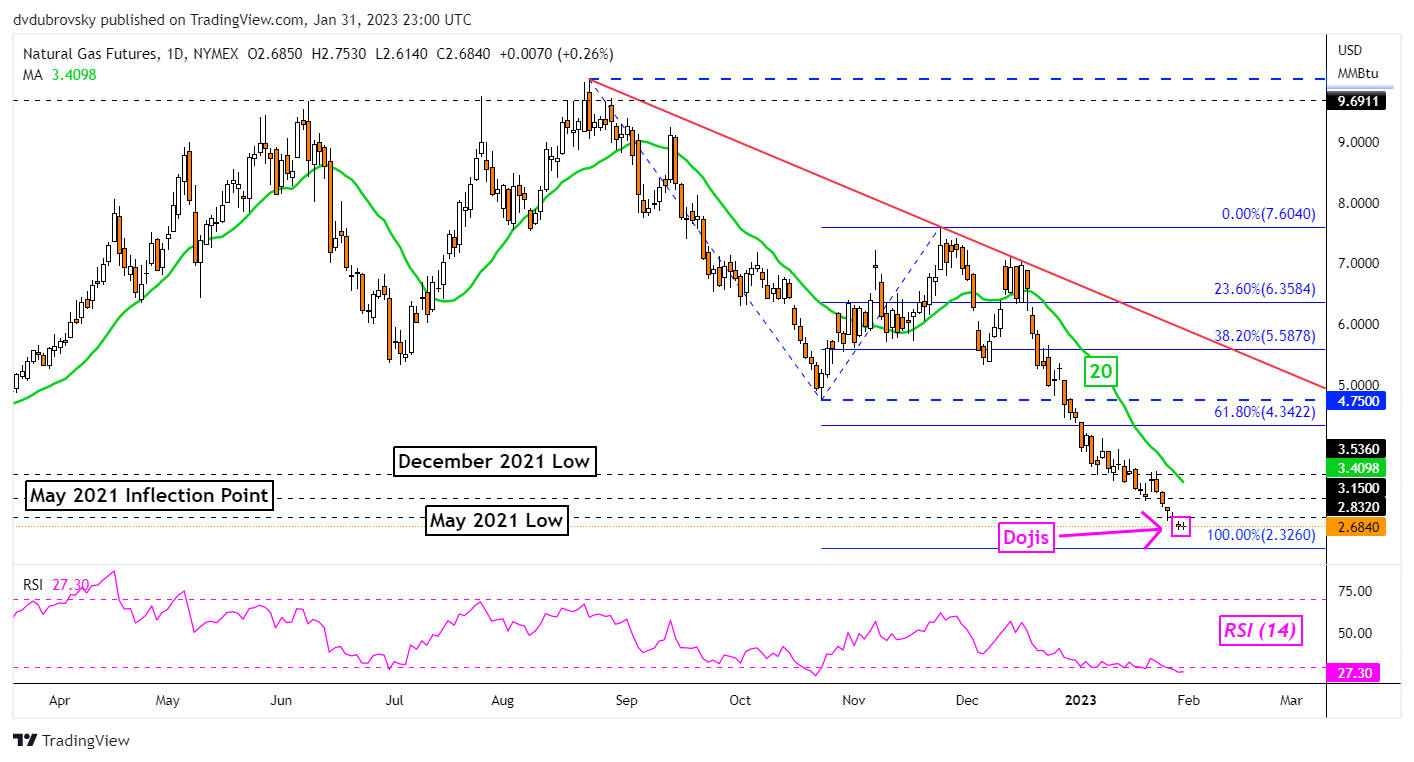
Chart Created Using TradingView
4-Hour Chart – Bullish Engulfing in Focus
Zooming in on the 4-hour chart reveals increasingly emerging reversal cues. Positive RSI divergence is now present, showing that downside momentum is fading. Furthermore, a Bullish Engulfing emerged within the past 24 hours. Prices subsequently pushed slightly higher. Albeit further upside confirmation is likely needed to argue the case for a material directional shift.
Immediate resistance is the 38.2% Fibonacci extension level at 2.759. Natural gas also remains below the 50- and 100-period SMAs in this timeframe. The latter two could maintain the downside focus. If not, prices may push higher toward the current 2023 high at 4.128. Otherwise, extending losses would open the door to facing 2021 lows (2.422 -2.453).

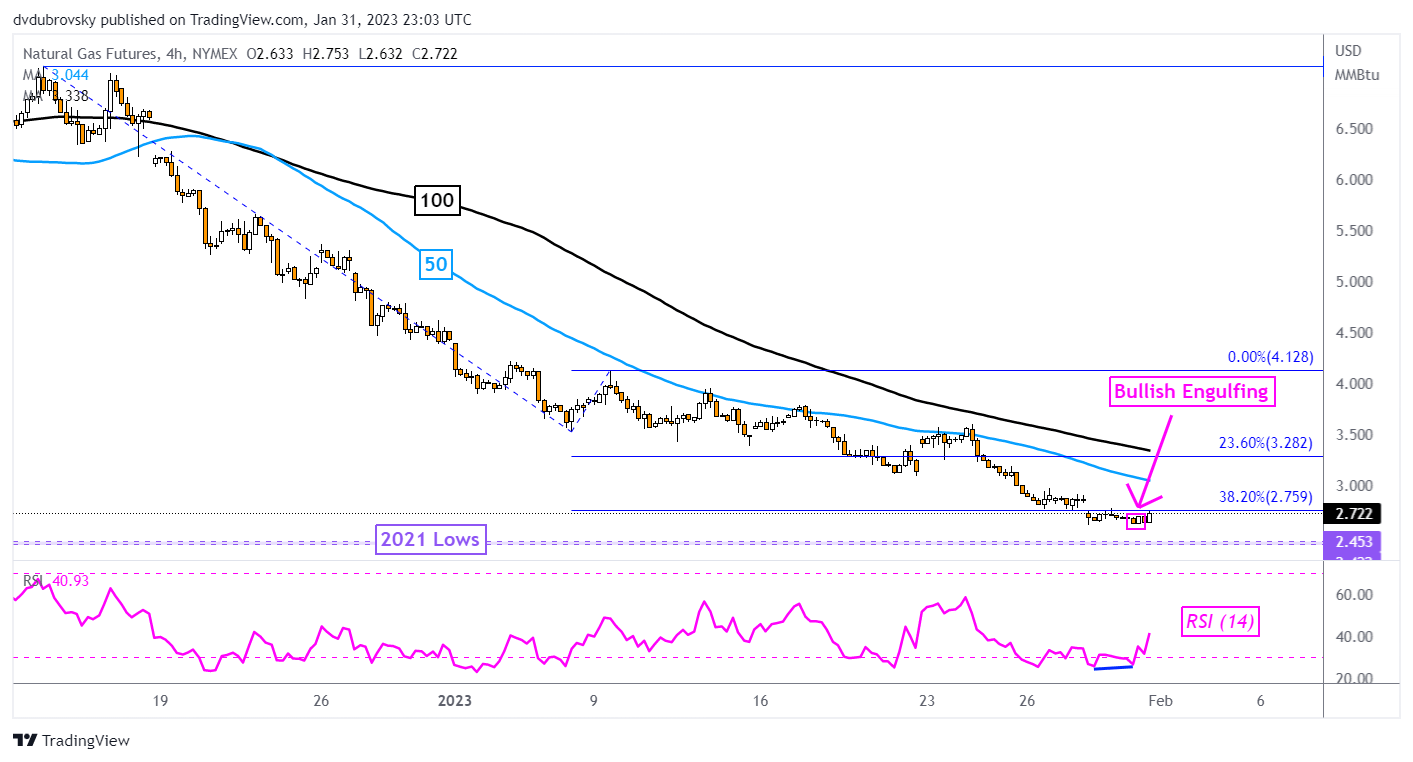
Chart Created Using TradingView
--- Written by Daniel Dubrovsky, Senior Strategist for DailyFX.com
To contact Daniel, follow him on Twitter:@ddubrovskyFX


