


Natural Gas, Head & Shoulders, Doji – Technical Outlook:
- Natural gas prices extend losses on Monday, more pain ahead?
- Another Doji emerged on the daily chart, watch for follow-through
- 4-hour chart shows natural gas idling above lows from 2021
Trade Smarter - Sign up for the DailyFX Newsletter
Receive timely and compelling market commentary from the DailyFX team
Daily Chart – Another Doji
Natural gas prices are off to another shaky start this week. The commodity has declined for 6 consecutive weeks and is setting up for a 7th drop. A closer look reveals that the past 2 months have been the worst performance for natural gas since 2008! Prices continue aiming lower in the aftermath of a bearish Head & Shoulders chart pattern.
On the daily chart, prices left behind a Doji candlestick pattern. While this is a sign of indecision, it does not necessarily mean that a reversal is brewing. On Friday, natural gas left behind an identical candlestick and continued lower the next trading day. It is important to watch for follow-through after signs of indecision emerge.
A daily push higher after the Doji could increasingly open the door to a turn higher. Still, that would place the focus on the 20-day Simple Moving Average (SMA). It could hold as resistance, maintaining the downside focus. Further losses place the focus on the 100% Fibonacci extension level at 2.326. Let us zoom in a little to see what the near term could look like.
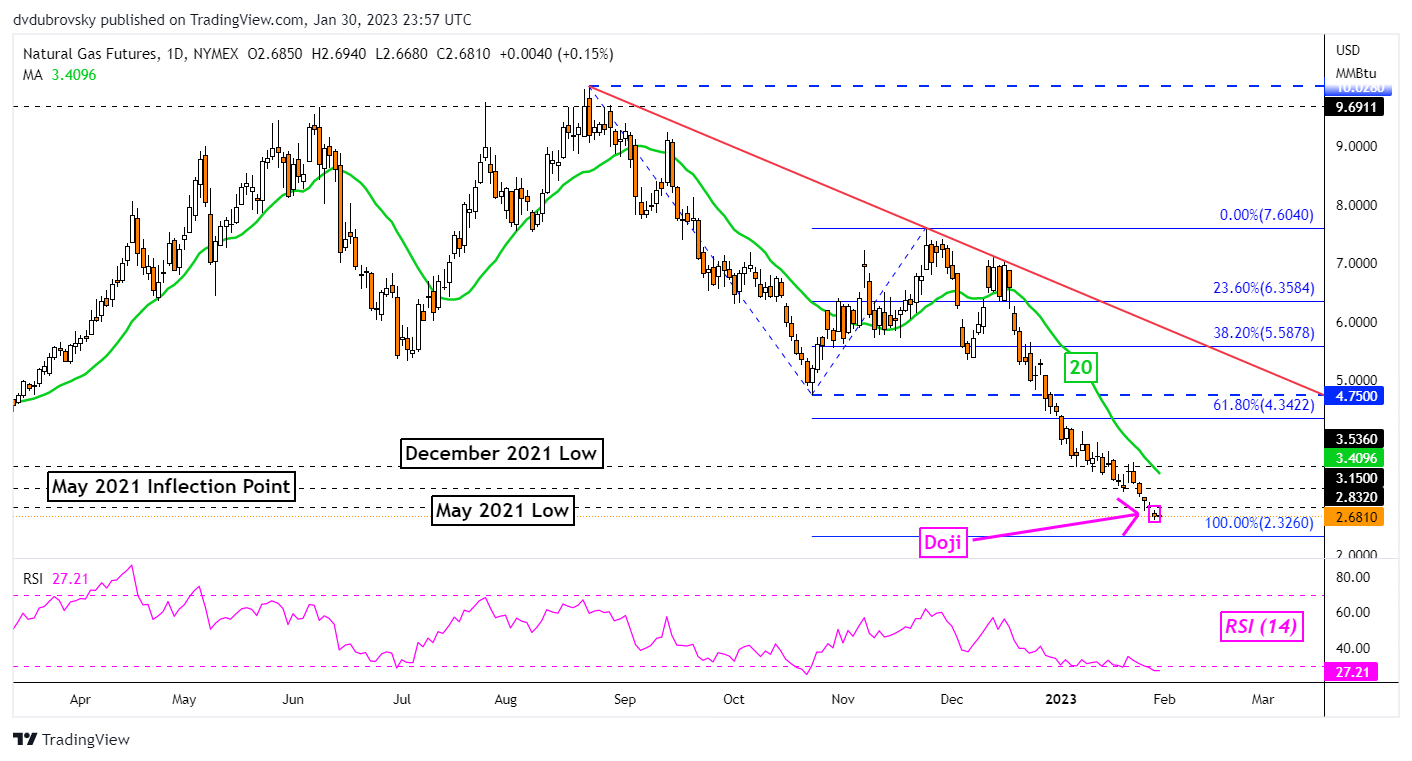
Chart Created Using TradingView
4-Hour Chart – Watch the 2021 Lows
On the 4-hour chart, natural gas is quickly approaching 2021 lows. This is a narrow range between 2.422 and 2.453. Prices are struggling to extend losses below the 38.2% Fibonacci extension at 2.759. Like the daily chart, the 50- and 100-period SMAs remain pointing lower. As such, these may maintain the downside focus in the event of a short-term upside reversal. Breaking above the 100-period SMA places the focus on the January 9th high at 4.128. Otherwise, breaking under 2021 lows exposes the 61.8% Fibonacci extension at 1.912.

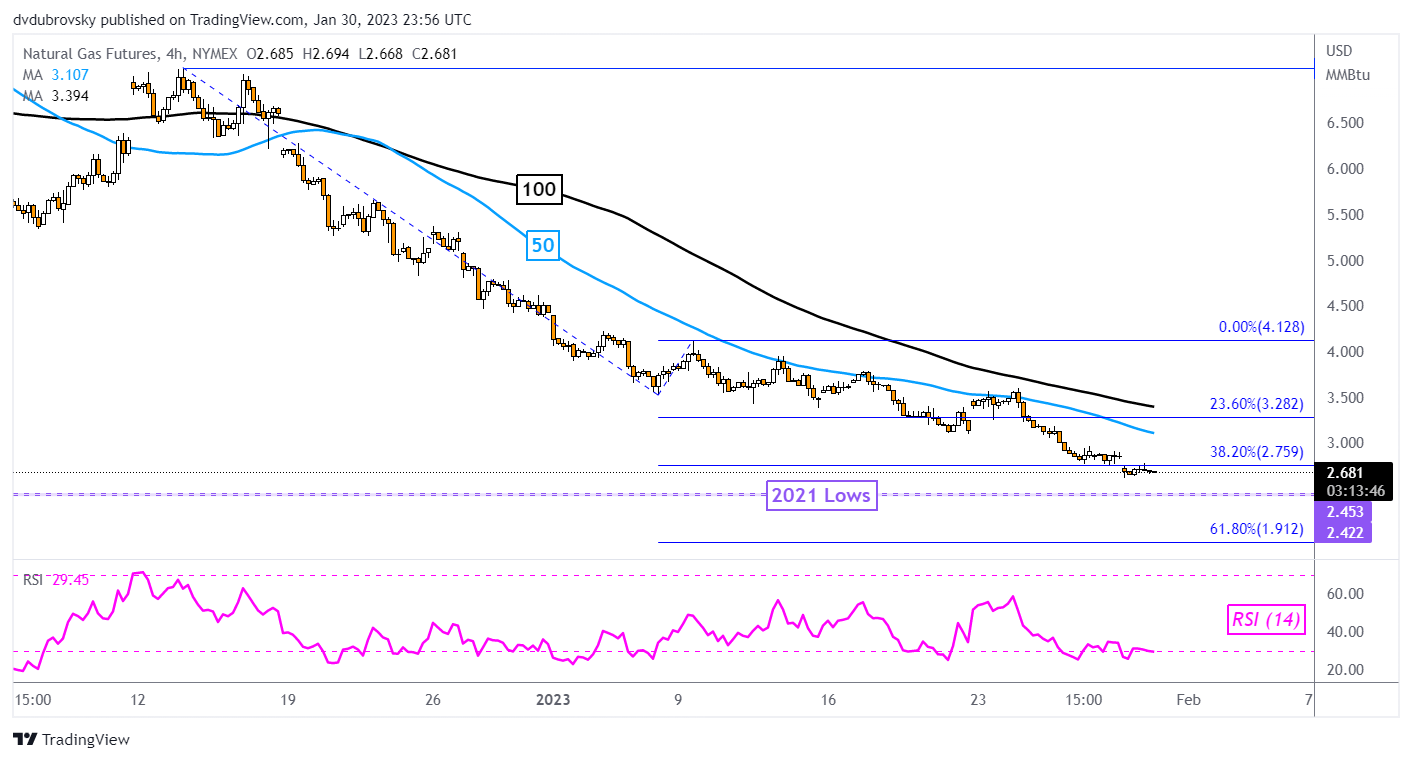
Chart Created Using TradingView
--- Written by Daniel Dubrovsky, Senior Strategist for DailyFX.com
To contact Daniel, follow him on Twitter:@ddubrovskyFX


