


US Dollar, Japanese Yen, USD/JPY - Technical Outlook:
- USD/JPY short-term downtrend remains intact.
- However, the slide appears to be losing steam.
- What are the signposts to watch?

USD/JPY SHORT-TERM TECHNICAL FORECAST – NEUTRAL
The fall to a 6-1/2-month low on Thursday confirms that downward momentum in USD/JPY remains intact for now. However, the slide appears to be losing steam as the pair approaches key support.
USD/JPY fell sharply after data showed US inflation was cooling, boosting hopes that the US Federal Reserve will be less aggressive in hiking interest rates going forward. The Japanese yen was also supported by a report that the Bank of Japan will review the side effects of its monetary easing at next week’s policy meeting and may take additional steps to correct the distortions in the yield curve.
On technical charts, the fresh multi-month low registered on Thursday is a sign that the trend remains bearish for USD/JPY, which has already fallen 15% from a 32-year high of 151.95 hit in October. On higher timeframe charts, including the weekly chart, momentum continues to be down (see Weekly chart).
USD/JPY Weekly Chart
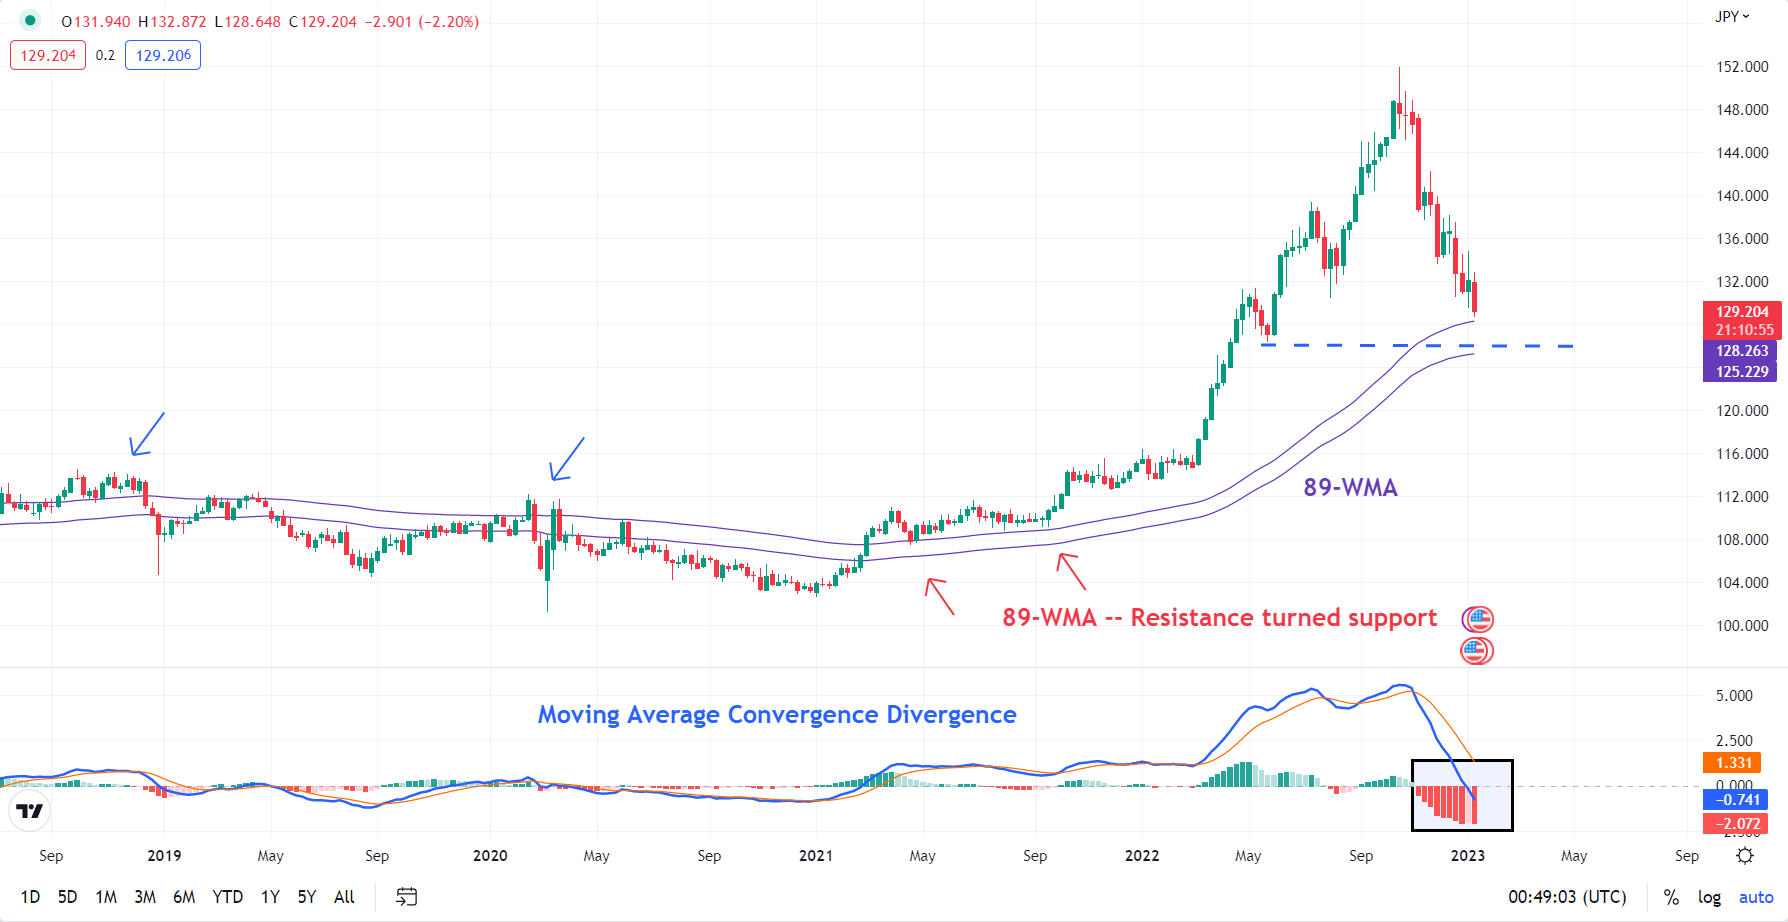
Chart Created Using TradingView
Having said that, the losses in recent weeks have occurred on slower momentum. That is, fresh price lows haven’t been accompanied by fresh lows in momentum, suggesting that the slide is losing steam (see Daily chart). This comes as USD/JPY is approaching quite a strong support area, including, the 89-week moving average, roughly coinciding with the May 2022 low of 126.30.
USD/JPY Daily Chart
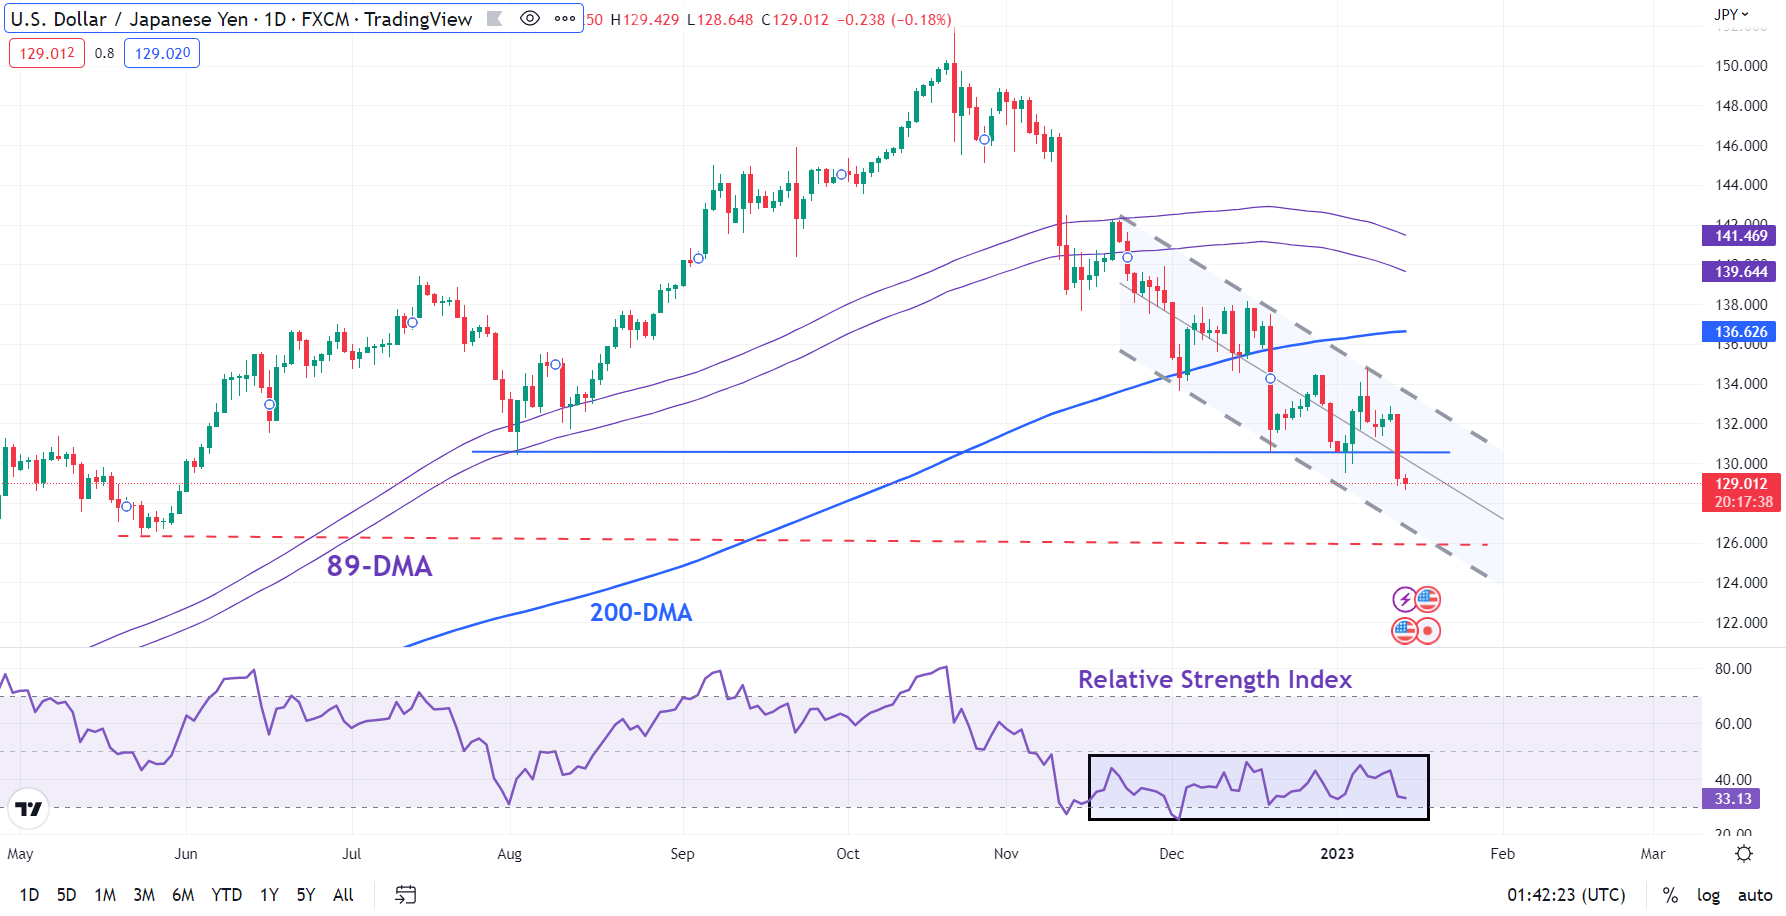
Chart Created Using TradingView
On its own, slowing downward momentum on shorter timeframe charts wouldn’t necessarily imply an imminent reversal of the downtrend, unless accompanied by the break of resistance. In this regard, the 132.80-134.80 area is of significance. This includes the 89-period moving average on the 4-hour chart (which has capped corrective rebounds in recent weeks), the upper edge of a downtrend channel since November, and last week’s high.
USD/JPY 240-minutes Chart
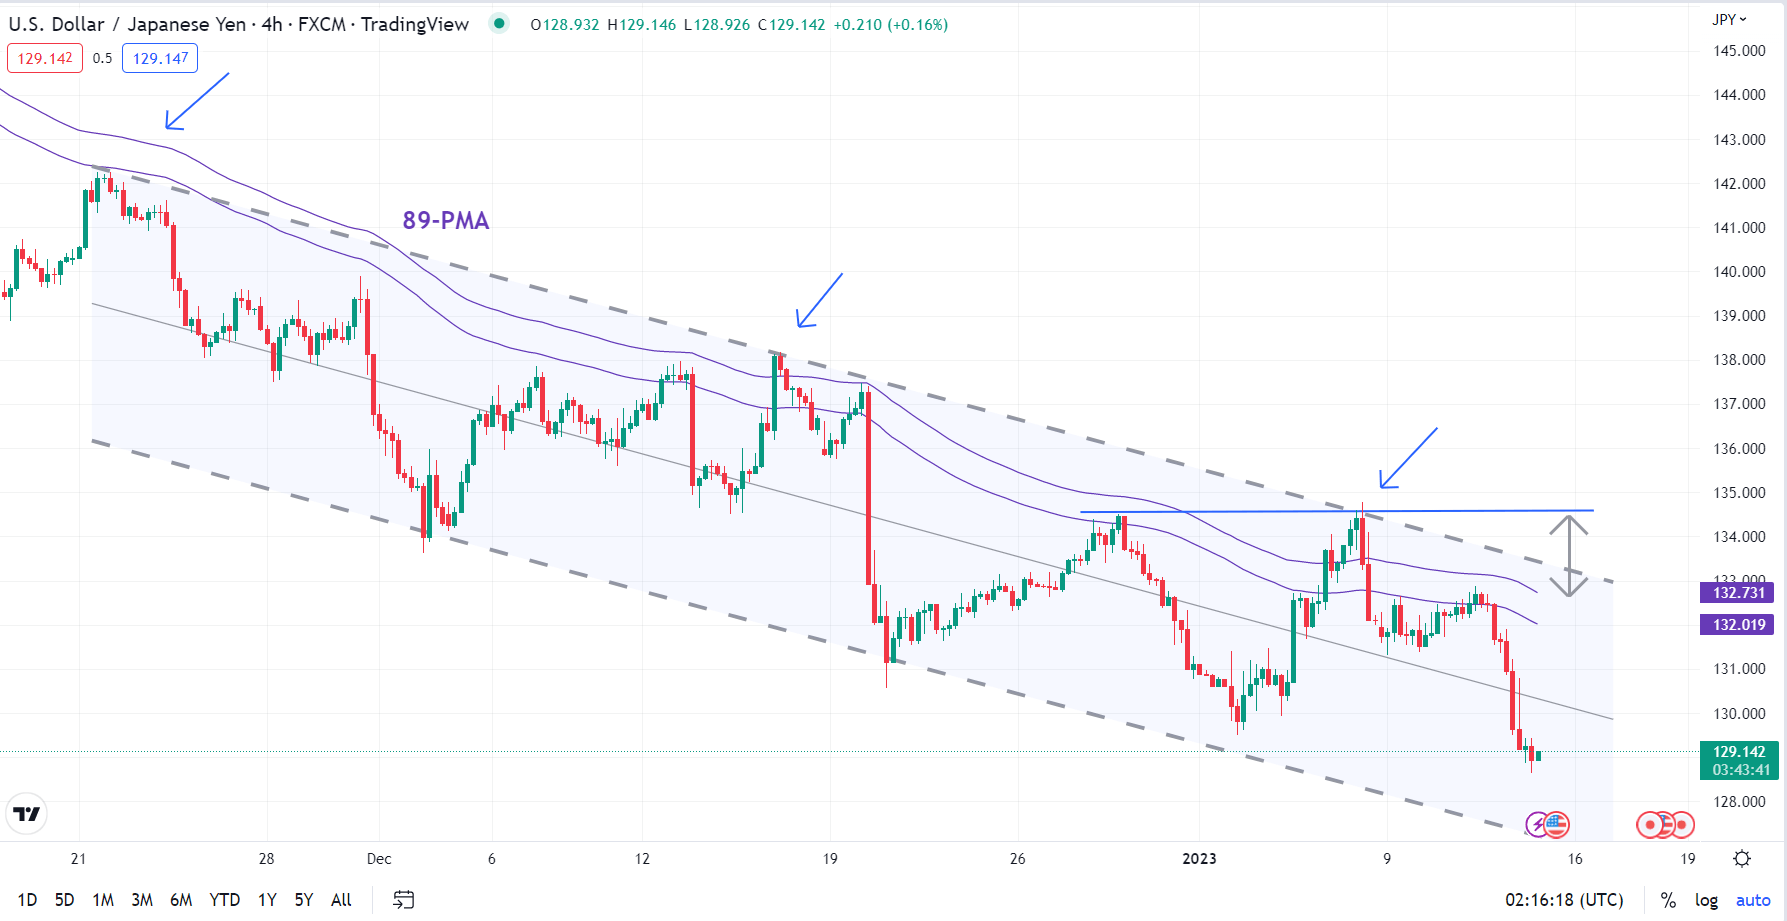
Chart Created Using TradingView
At a minimum, USD/JPY needs to clear the above-mentioned hurdle to imply that the downtrend was beginning to reverse. Until then, the balance of risks remains skewed to the downside toward the May 2022 low of 126.30.

--- Written by Manish Jaradi, Strategist for DailyFX.com


