


GBP/USD, BRITISH POUND - Technical Outlook:
- GBP/USD has broken above vital resistance.
- The resistance break points to further rise.
- What is the outlook and the signposts to watch?

GBP/USD SHORT-TERM TECHNICAL FORECAST – BULLISH
The British Pound’s break above key resistance this week against the US Dollar not only points to further gains in the coming days and weeks, but also strengthens the base-building case outlined a few weeks ago.
GBP/USD has risen above key converged resistance: the early-October high of 1.1495 and a minor downward-sloping trendline from early October. The breakout from the trendline which is the top of a minor triangle confirms that the recent range was a consolidation within a broader recovery structure (see chart). Moreover, this confirms Scenario 1 outlined last week – the shallow retreat middle of the month from the early-October high – paints a relatively bullish view.
GBP/USD Daily Chart
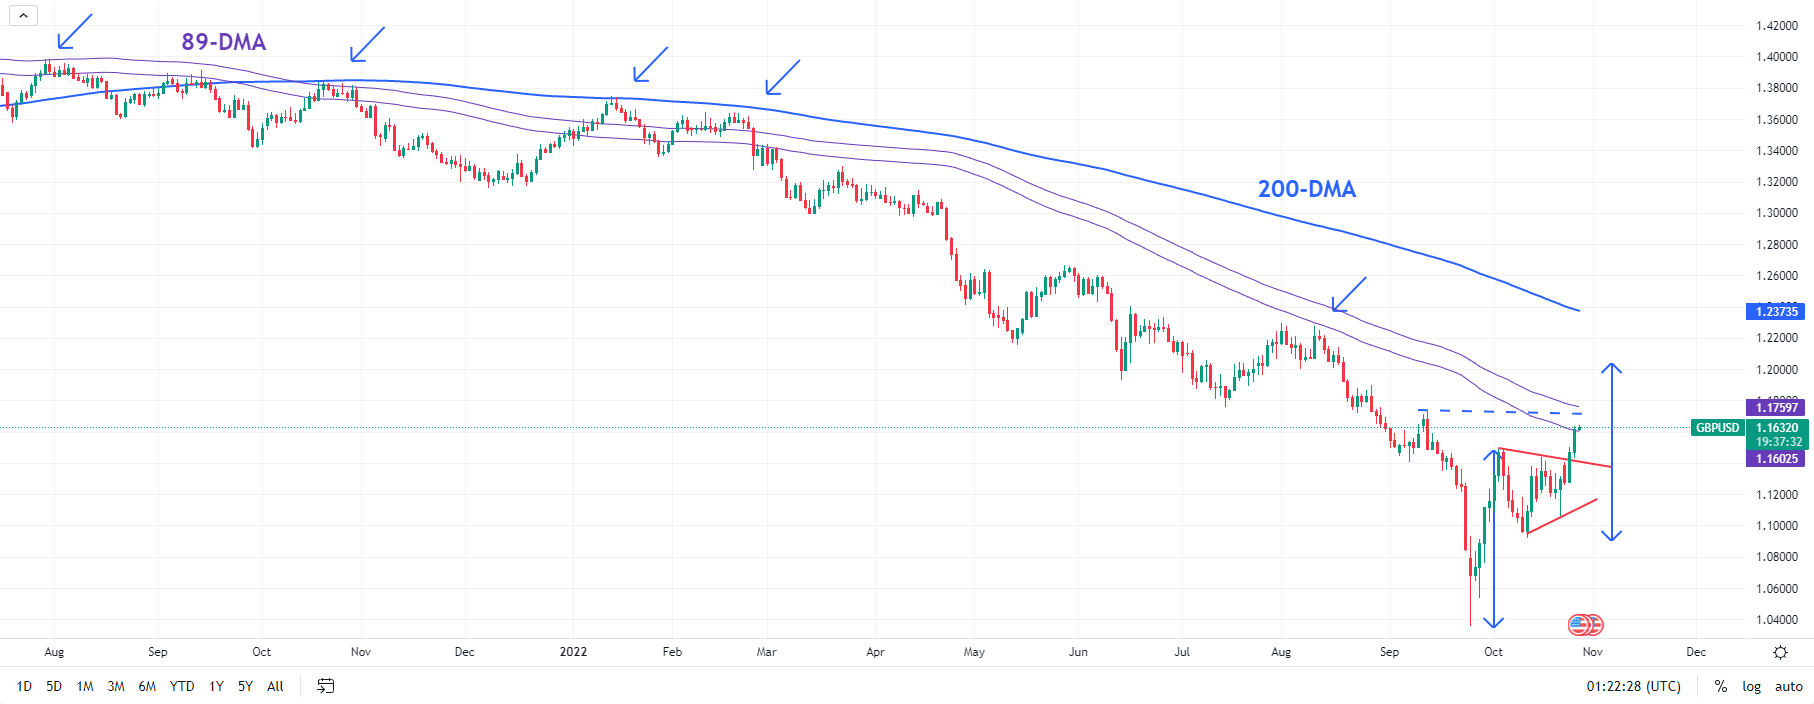
Chart Created Using TradingView
GBP/USD looks set to test the mid-September high of 1.1740, roughly coinciding with the 89-day moving average. This resistance is crucial: the last time the pair was above the average was in 2021, so a decisive break above it would be significant. Such a break could open way towards the 200-day moving average (now at about 1.2375).
If the pair manages to close this week around Thursday’s Asia morning high, then it would be the first time since end 2021 that it will be decisively above the 10-week moving average. Back then the rise above this barrier was followed by two more weeks of gains (see chart). Overall, the developments on the charts this week strengthen the case that GBP/USD has made an interim low at the September low of 1.0385, especially considering positioning, sentiment, and valuations.
GBP/USD Weekly Chart
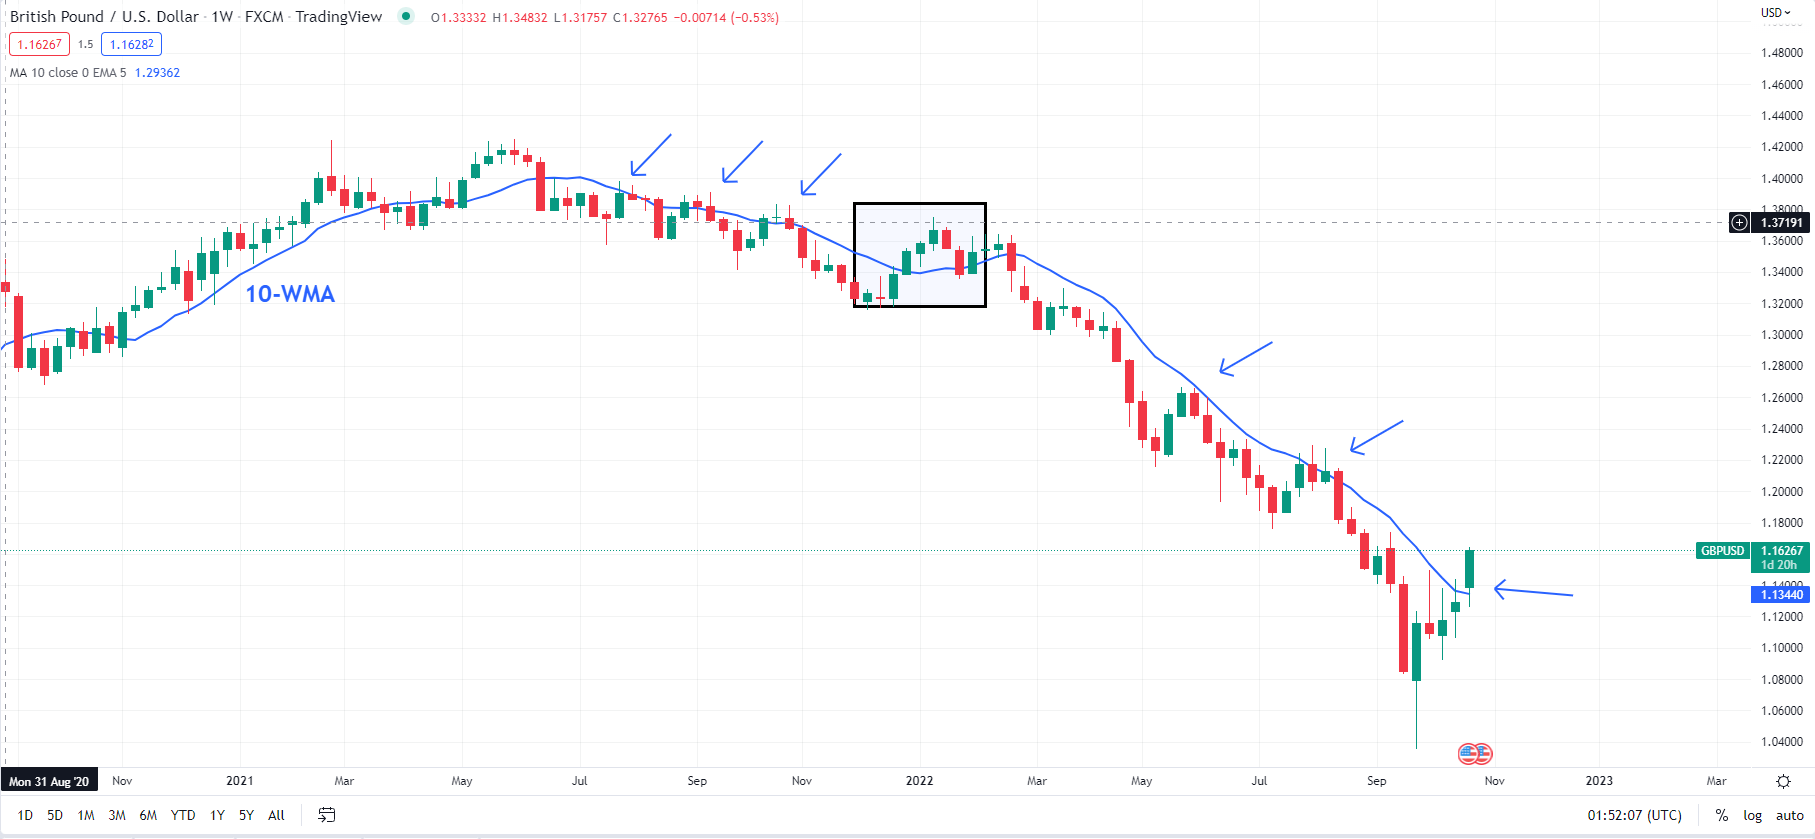
Chart Created Using TradingView
On the downside, there is immediate cushion at the resistance-turned-support at the early-October high of 1.1495 followed by the last week’s low of 1.1060. Stronger support is at the mid-October high of 1.0925.

--- Written by Manish Jaradi, Strategist for DailyFX.com


