


GBP/USD, BRITISH POUND - Technical Outlook:
- GBP/USD has retreated from key resistance.
- Has the six-week rally run its course?
- What is the outlook and the signposts to watch?

GBP/USD SHORT-TERM TECHNICAL FORECAST – BULLISH
The British pound’s retreat against the US dollar from near-key resistance has taken the sting out of the recent rally. After briefly rising above resistance at the early-October high of 1.1495, GBP/USD succumbed to gains near strong converged resistance at about 1.1700-1.1750 (including the 89-day moving average and the mid-September high of 1.1740. The last time the pair was above the average was in 2021.
GBP/USD Daily Chart
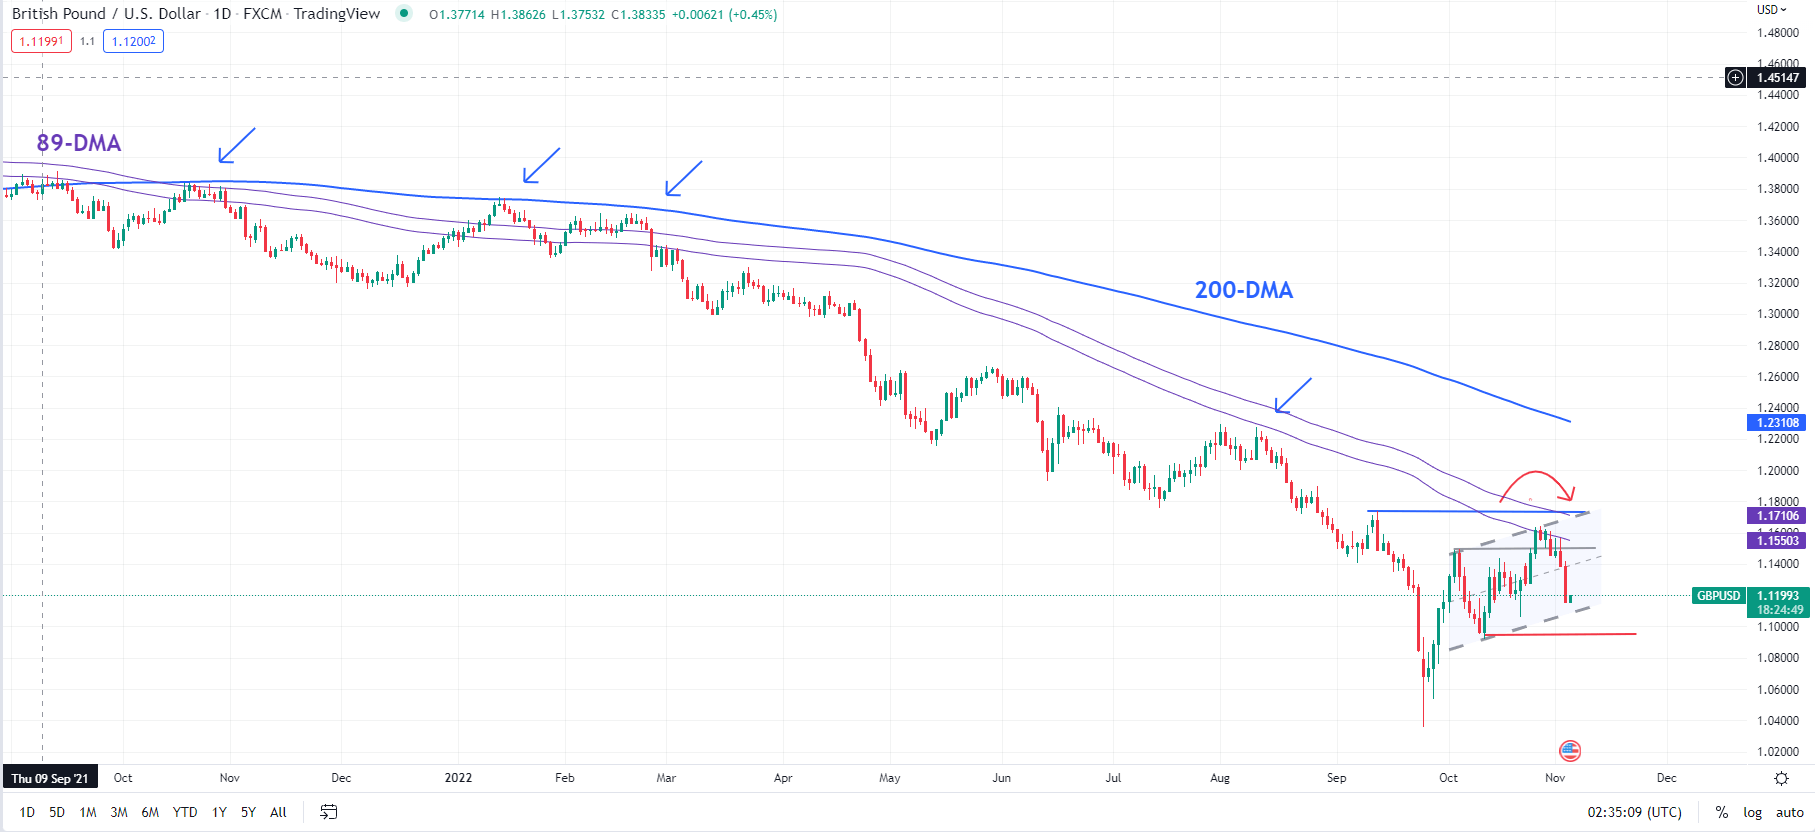
Chart Created Using TradingView
The retreat now brings GBP/USD to the lower edge of a minor ascending channel from early October (now at about 1.1000). A break below would confirm that the short-term upward pressure had faded, risking a drop toward a vital cushion at the October low of 1.0925. Cable needs to hold above 1.0925 for the recovery trend to remain intact. That’s because a decisive break below 1.0925 could expose downside risks towards the September low of 1.0385.
On the weekly charts, the fall this week below last week’s bottom of 1.1255 is a weak indicator. If the pair closes lower next week on the weekly chart (relative to this week), then the chances of a retest of 1.0925 would rise (see chart).
GBP/USD Weekly Chart
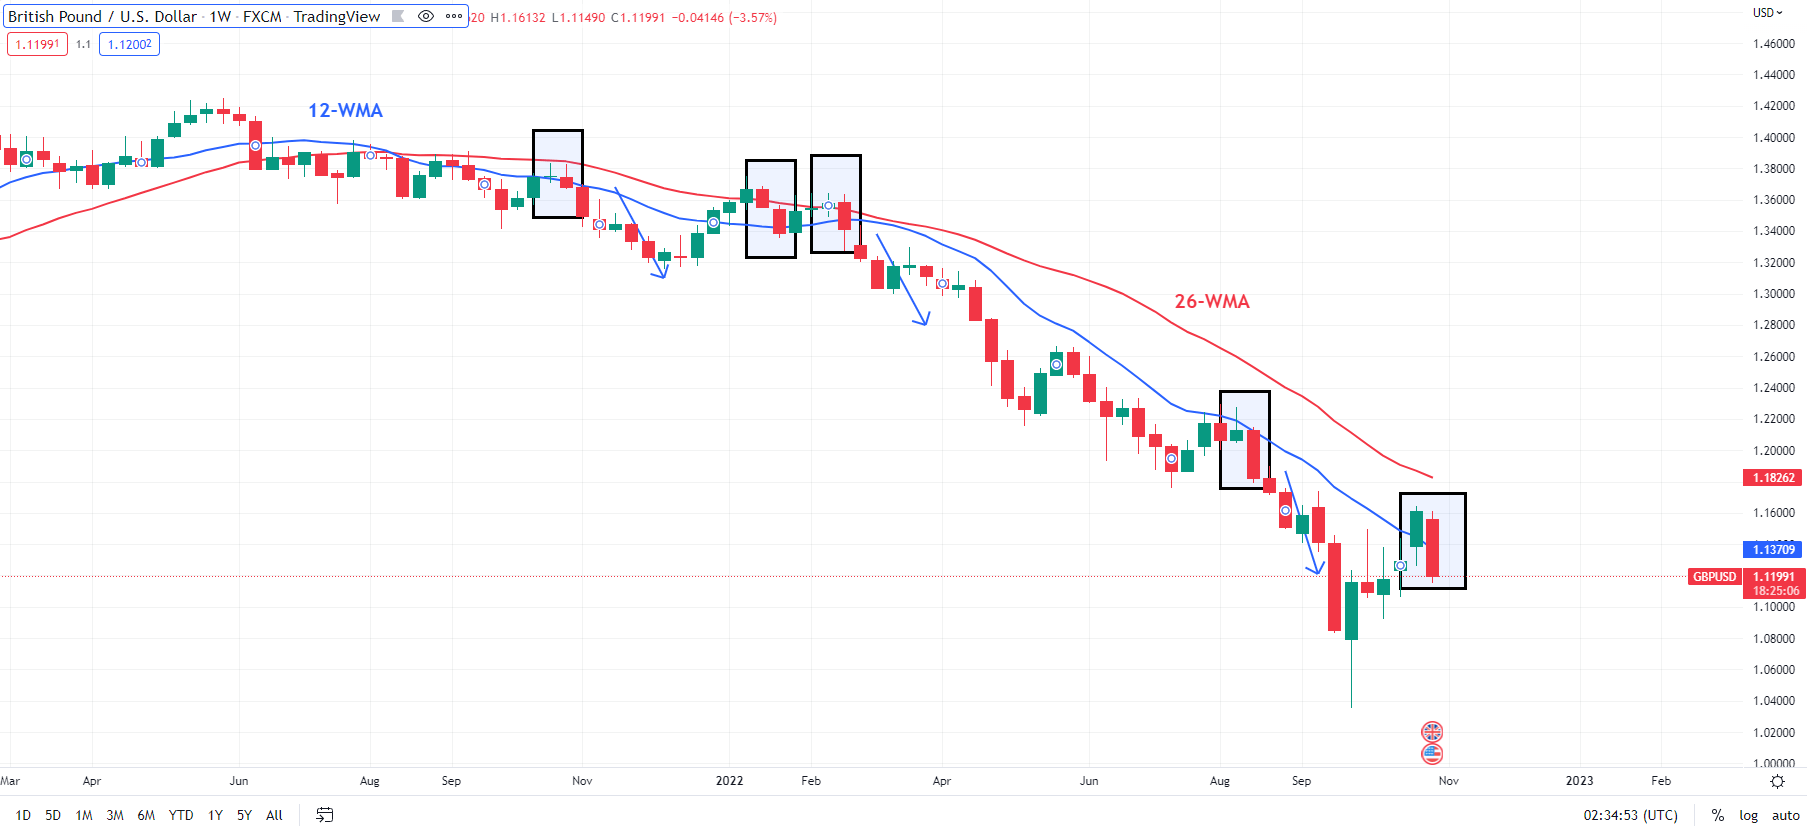
Chart Created Using TradingView
On the positive side of things, GBP/USD’s rise end of October to a six-week high is an encouraging signal. Despite the choppiness associated with the rebound from September (which in a way is understandable given the heavy damage in recent months), GBP/USD has maintained a higher-high-higher-low formation on the daily charts. So, it would be too soon to conclude that the uptrend has reversed, even though this week’s slide could be a warning message.
Looking beyond the immediate term, GBP/USD appears to have made an interim low (first highlighted in early October). What is unclear, however, is whether / how likely is a retest of the September low of 1.0385 (or below). In this regard, 1.0925 could offer some guidance. For one, a break below the cushion would disrupt the higher-high-higher-low pattern on the daily chart. Secondly, it would imply a lower low on the weekly chart (relative to this week), raising the risk of a retest of 1.0385.

--- Written by Manish Jaradi, Strategist for DailyFX.com


